
Figures & data
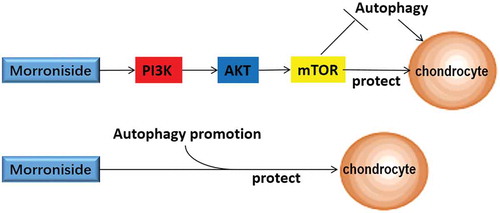
Table 1. Specific primer sequences for qPCR.
Figure 1. Morroniside inhibits the autophagic activity of chondrocytes.
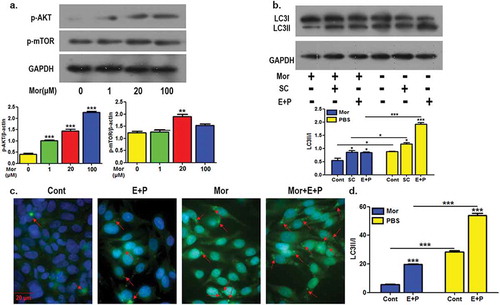
Figure 2. The inhibition of PI3K/AKT/mTOR signaling reverses the inhibition of Morroniside on chondrocyte autophagy.
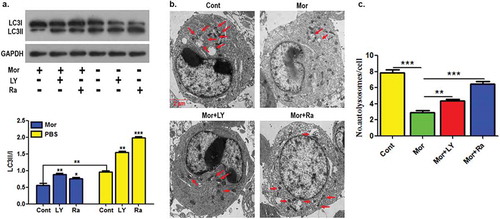
Figure 3. The inhibition of PI3K/AKT/mTOR signaling does not affect the protection of Morroniside on chondrocytes.
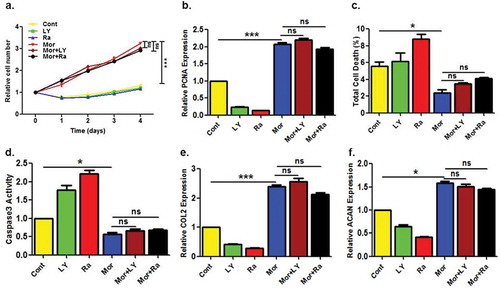
Figure 4. Overexpression of autophagy genes enhanced the protection of Morroniside on chondrocytes.
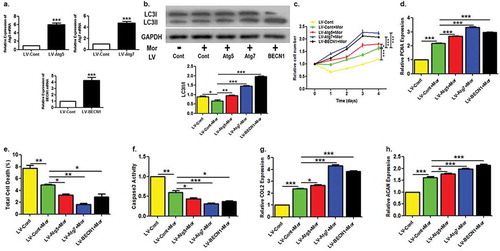
Figure 5. The schematic diagram representing the working model in our study.

Data availability statement
The data described in this article are openly available in the Open Science Framework at DOI:10.17605/OSF.IO/TPA6U.