
Figures & data
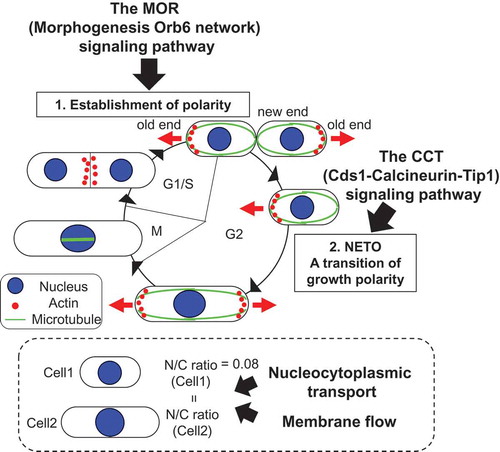
Figure 1. Cell polarity of fission yeast is coordinated with the cell cycle (a) and its nuclear size is proportional to cell size (b), resulting in constant ratio between nuclear and cellular volume (N/C ratio) (c).
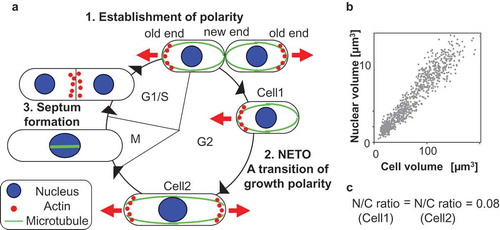
Table 1. Components of the MOR and the SIN.
Figure 2. Essential components of the MOR and a cross talk between the SIN and the MOR.
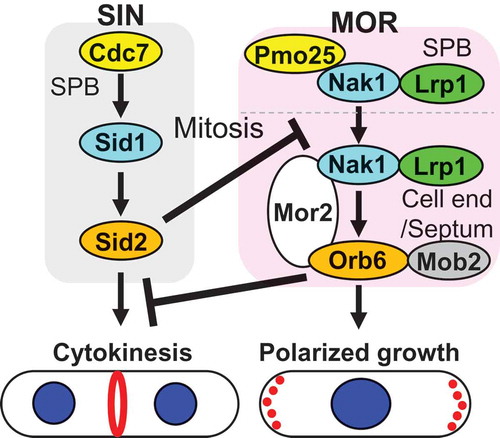
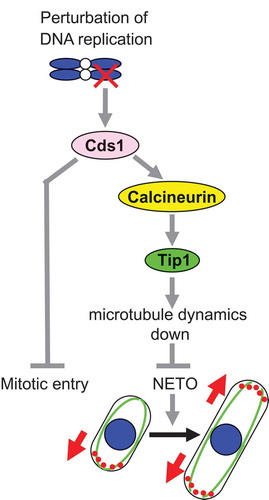
Figure 3. The CCT (Cds1-Calcineurin-Tip1) pathway and its role in NETO delay when DNA replication is perturbed.
Data availability statement
The data described in this article are openly available in the Open Science Framework at DOI:10.17605/OSF.IO/TPA6U.