Figures & data
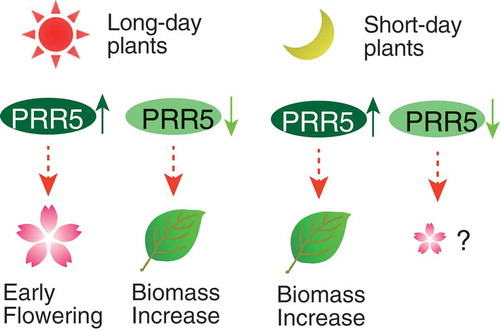
Figure 1. Phylogenic tree of PRR proteins and effect on flowering time in annual plants. Phylogenic tree was inferred by the neighbor-joining method. Protein sequences of pseudo-receiver (PR) domains of Arabidopsis PRR (AtPRR or AtTOC1), rice PRR (OsPRR), a barley PRR (Ppd-H1), a wheat PRR (Ppd-D1a), and a sorghum PRR (SbPRR37, Ma1) were used to construct the phylogenic tree. PF is a photoperiod condition for flowering. Sun and moon symbols indicate either a long-day plant or a short-day plant from which the corresponding PRR was isolated, respectively. E.PRR is the effect of the corresponding PRR on flowering time. Leaf and flower symbols indicate suppression and induction effects on flowering, respectively. For example, OsPRR37 (Hd2) is a flowering suppressor of a short-day plant. Note that AtPRR3 changes a conserved amino acid in the CCT domain, and the effect of AtTOC1 on flowering time is complicated. See details in the text.
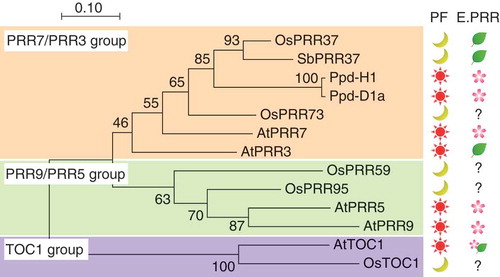
Figure 2. Transgenic rice expressing PRR5-VP. (a) Accumulation of PRR5-VP protein in T0 transgenic rice. The numbers indicate independent transgenic rice lines. Two acrylamide gels were used (left and right of the red line), but immunoblotting was performed in a same experiment. Original gel images are shown in Supplemental Figure 1. (b) Photograph of PRR5-VP rice. Rice plants regenerated from callus on the same day are shown. (c) Relationship between plant height and relative PRR5-VP protein amount. Blue and green dots are vector and PRR5-VP plants, respectively.
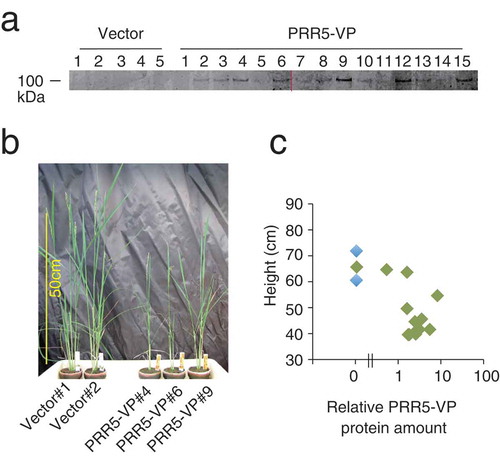
Figure 3. Transgenic rice expressing PRR5-FLAG. (a) Accumulation of PRR5-FLAG protein in T0 transgenic rice. The numbers indicate independent transgenic rice lines. Two acrylamide gels were used (left and right of the red line), but immunoblotting was performed on a same experiment. Original gel images are shown in Supplemental Figure 2. (b) Photograph of PRR5-FLAG rice. Rice plants regenerated from callus on the same day are shown. (c) Relationship between plant height and relative PRR5-FLAG protein amount. Blue and red dots are vector and PRR5-FLAG plants, respectively.
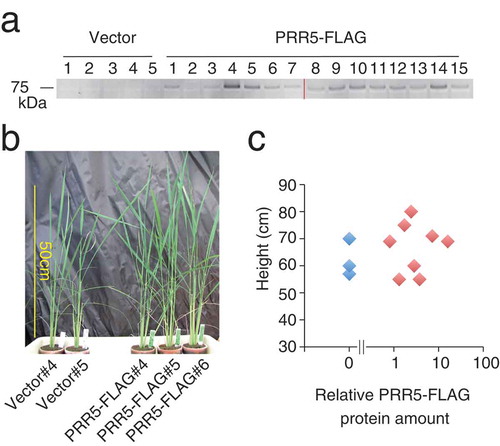
Table 1. Heading date of T1 transgenic rice. Days-to-heading after germination was measured (mean ± S.E.). Only plants having a transgene were analyzed for Vector, PRR5-FLAG, and PRR5-VP rice.
Figure 4. Biomass of PRR5-FLAG-expressing rice. (a) Photograph of T3 plants at about 100 days after germination. Red bars indicate 20 cm (left scale). Dry weight of (b) total plant tissues, (c) vegetative tissues (leaves and stems), (d) roots, and (e) grains. (f) Grain filling rate. Error bars indicate the SE of four biological replicates, and asterisks indicate statistical differences compared with the control line (Student t test; P < 0.05) for (b) to (f).
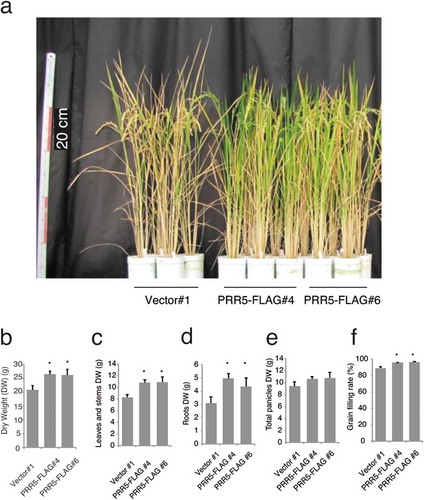
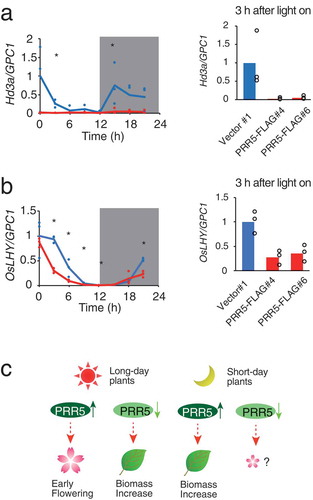
Figure 5. Expression of Hd3a and OsLHY in PRR5-FLAG rice. (a) Expression of Hd3a and (b) OsLHY normalized with glyceraldehyde-3-phosphate dehydrogenase (OsGPC1) in rice. Note that OsGPC1 expression was not cyclic. Blue and red lines indicate Vector#1 and PRR5-FLAG#4, respectively. Blue and red dots indicate biological replicates of Vector#1 and PRR5-FALG#4, respectively (left panels). Maximal expression in Vector#1 was defined as 1.0. Gray areas indicate the dark period. Asterisks are significant changes between Vector #1 and PRR5-FLAG #4 (Student’s t-test p < 0.05) (left panels). Expression of Hd3a and OsLHY in PRR5-FLAG#6 at 3 h after light on (n = 3, right panels). Bar and dots indicate mean and individual values, respectively. (c) Model for the effect of the PRR9/PRR5 sub-group on flowering time and plant biomass. Enhancement of PRR5 function in long-day plants results in early flowering, but attenuation of PRR5 causes a biomass increase due to late flowering. Enhanced PRR function in short-day plants increases biomass likely through flowering-dependent pathways.