
Figures & data

Figure 1. Structures of compounds 1–8.
Table 1. The NMR date for compound 1.
Figure 2. The 1H-1H COSY and key HMBC correlations of compound 1.
Figure 3. The experimental ECD spectrum of compound 1 and the calculated one for its S-isomer.
Figure 4. The HPLC spectra (detected under 254 nm) of compound 1 and the extracts of A. terreus C23-3 culture on soybean medium with 5-azacytosine (the main fermentation), A. terreus C23-3 culture on soybean medium (control), and non-inoculated soybean medium. (1: psoralenone; 2: genistein; 5: biochanin A; 7: butyrolactone I).
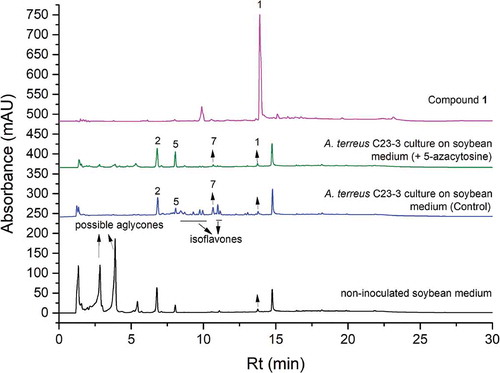
Figure 5. Evaluation of cytotoxicity (line) and inhibition of LPS-induced NO production (bars) by compound 1 at 32 μM. 1% ethanol alone served as the negative control, and with DMSO (0.75%) was used as the positive control. (n = 3; **** and ***represent adjusted P values of <0.0001 and 0.0005, respectively). Amount of NO production calculated from a standard curve.
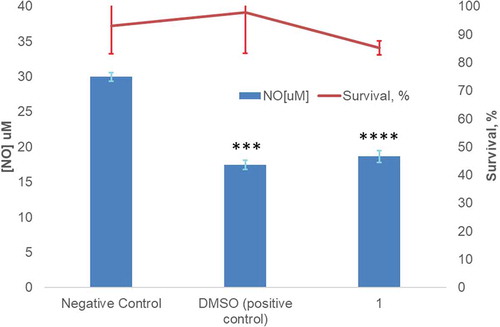
Table 2. Antimicrobial activities of compounds 2–8 (paper disk method, 10 µg/disk, n = 3).
Table 3. DPPH free radical scavenging, acetylcholinesterase inhibitory, and larvicidal activities of compounds 2–8 (n = 3).