Figures & data
Table 1. Student characteristics (only graduates who went to university at some point between 2004 and 2013) in single-sex and coeducational schools: proportions, means, and Cohen’s d.
Table 2. Relative risk ratios of young women choosing a physical science or life science major relative to a non-science major.
Table 3. Relative risk ratios of young men choosing a physical science or life science major relative to a non-science major.
Figure 1. Predicted probabilities of young women enrolling in a physical science or life science major by gender composition of school.
Data: LSAY 2003.
Note: The predicted probabilities are based on the multinomial logistic regression models presented in and computed with other variables held at the mean for each type of school.
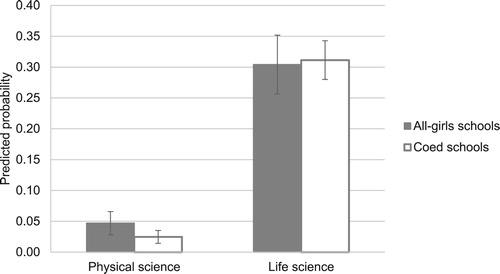
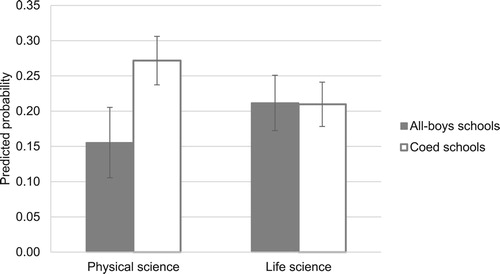
Figure 2. Predicted probabilities of young men enrolling in a physical science or life science major by gender composition of school.
Data: LSAY 2003.
Note: The predicted probabilities are based on the multinomial logistic regression models presented in and computed with other variables held at the mean for each type of school.