
Figures & data
Figure 1. PRISMA flow diagram.
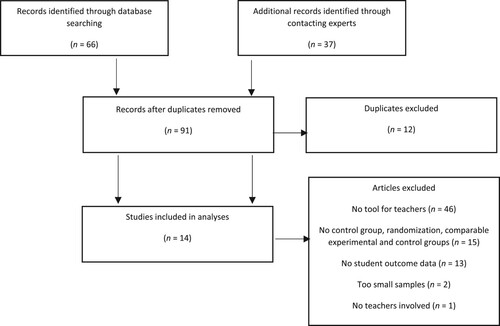
Table 1. Included studies.
Table 2. The features of the digital monitoring tools (DMTs) and the interventions.
Figure 2. Forest plot of the effects found in the included studies.
Note: TE = treatment effect; seTE = standard error treatment effect; SMD = standardized mean difference; CI = confidence interval.
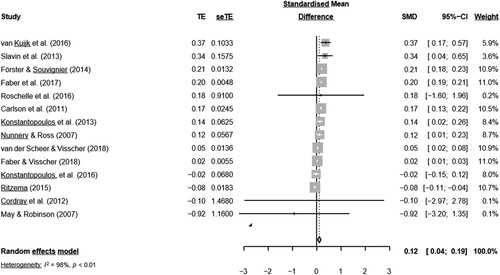
Table 3. The effect sizes for the included studies based on multilevel analyses.