Figures & data
Table 1. Frequency table – strength of schools in socially deprived areas.
Table 2. Frequency table – difficulties of schools in socially deprived areas.
Table 3. Frequency table – challenges of schools in socially deprived areas.
Table 4. Frequency table – development perspective of schools in socially deprived areas.
Figure 1. Latent profile analysis – all schools.
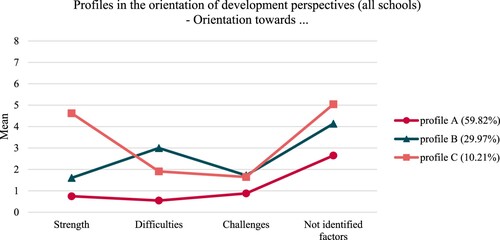
Table 5. Model fit for latent profile analysis with different numbers of profiles.
Figure 2. Latent profile analysis – primary schools.
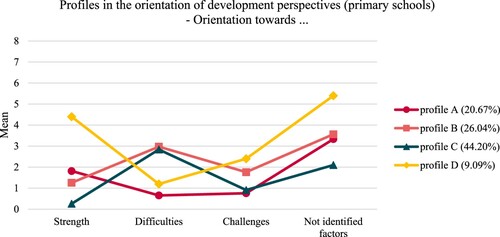
Figure 3. Latent profile analysis – middle schools.
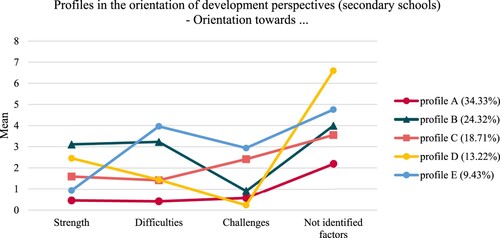
Figure 4. Latent profile analysis – schools that perform above the statistically expected value in the educational standard assessment.
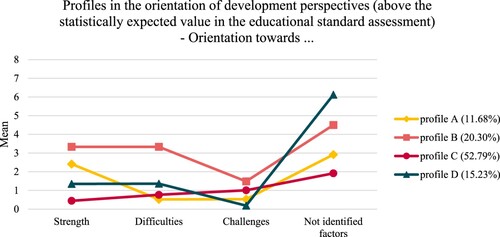
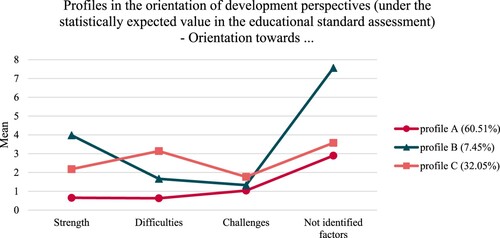
Figure 5. Latent profile analysis – schools that perform under the statistically expected value in the educational standard assessment.