Figures & data
Figure 1. Flow diagram depicting the study sample inclusion.
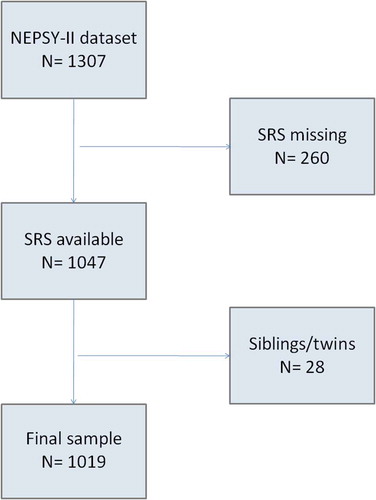
Table 1. Demographic and clinical characteristics of the study sample.
Table 2. Neuropsychological performance between children with an autism spectrum disorder diagnosis and typically developing children.
Table 3. Model adjustments controlling for gender and age (Model I) and five additional covariates (Model II).
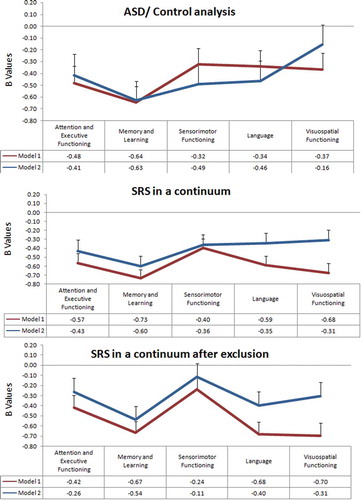
Figure 2. NEPSY-II performance across five different neuropsychological domains evaluating (top) an ASD/control analysis, (middle) SRS along the continuum with neuropsychological performance, and (bottom) SRS along the continuum with neuropsychological performance after excluding children with ASD and clinical SRS scores. Model I is adjusted only for age and gender, and Model II is additionally adjusted for age at SRS, gender, child ethnicity, maternal education, household income, maternal alcohol use, and smoking during pregnancy.