
Figures & data
Figure 1. DMS on a touch screen: Simultaneous view of target and stimuli (option 3 is identical to target), and covert (delayed) target (this is not a real CANTAB® DMS sample).
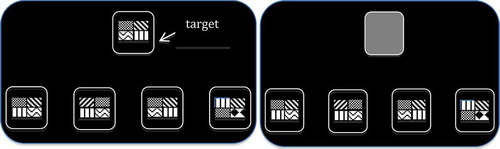
Table 1. Basic demographic data.
Table 2. Mean and standard deviation of all DMS outcome measures.
Figure 2. Observed scores for the mean DMS accuracy (i.e., total, overt and covert conditions) comparing the Ukrainian sample to the CANTAB® traditional mean norms (2-year age groups).
Figure 3. Observed scores for the mean DMS response latency for accuracy scores (i.e., total correct, overt correct and covert correct conditions), comparing the Ukrainian sample to the CANTAB® traditional mean norms (2-year age groups).
Figure 4. Observed scores for the mean DMS probability of error after an incorrect response comparing the Ukrainian sample to the CANTAB® mean norms (2-year age groups).
Table 3. Pearson zero order correlations for DMS accuracy, response latency, and probability of an error after an error variables.
Table 4. Final regression models for the DMS accuracy (all conditions), response latency and probability of an error after an incorrect response.
Figure 5. Expected test scores based on the regression models for the DMS accuracy (total correct), accuracy overt (simultaneous), accuracy covert (all delay) conditions with maximum scores of 20, 5 and 15, respectively. All scores were stratified by age, but the accuracy (total) and accuracy covert (all delay) conditions are shown for higher level of parental education (LPE).
Figure 6. Expected standardized scores based on the regression models for the DMS accuracy (total) and DMS probability of error of an incorrect response.
Table A1. Normative data for the DMS Accuracy (Total Correct) score, stratified by age and level of parental education (LPE).
Table A2. Normative data for the DMS Accuracy Covert (All Delays) score, stratified by age and level of parental education (LPE).
Table A3. Cumulative percentages for the DMS Accuracy Overt (Simultaneous) score stratified by age from 4 correct and lower (as the rest achieves the maximum score of 5 correct, i.e., 100%).
Table A4. Normative data for the DMS Response Latency (accuracy and accuracy covert condition) stratified by sex.
Table A5. Normative data for the DMS Response Latency overt (simultaneous) condition stratified by age and sex.
Table A6. Normative data for the DMS probability of an error after an incorrect response score, stratified by age and level of parental education (LPE).