
Figures & data
Table 1. Respondent demographic characteristics and background experience (N = 286).
Table 2. Availability and perceived usefulness of data sources.
Table 3. Frequency of data use by purpose and data source.
Figure 1. Proportion of available data sources used frequently, by purpose.
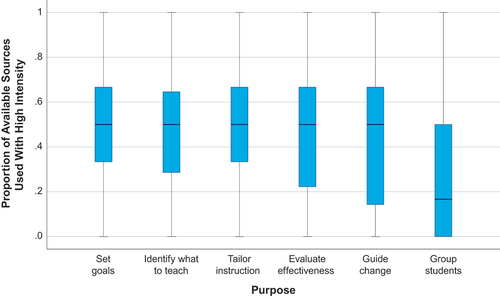
Table 4. Perceptions of data and data use.
Figure 2. High-frequency data use to identify what to teach, by type of data perceived as useful.
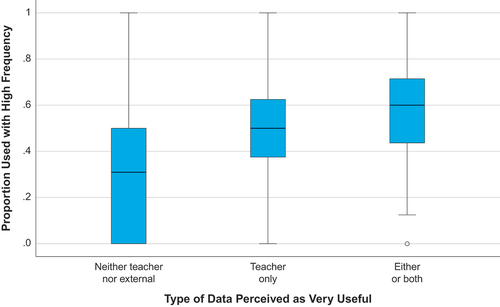
Table 5. Correlations between perceptions and data use for instructional decisions (N = 359).
Table 6. Differences in data use by types of data perceived as useful (N = 359).