Figures & data
Table 1. Descriptive results and correlations between the reverse-coded items used in the inquiry-based instruction scale.
Table 2. Inquiry-based instruction by item predicting science achievement.
Figure 1. Inquiry-based approaches associated with increased levels of achievement.
Note: The error bars represent ±1 SD.
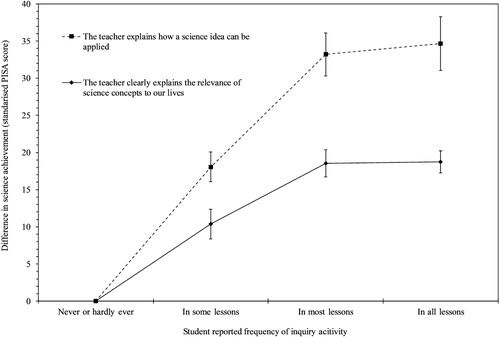
Figure 2. Inquiry-based approaches associated with decreased levels of achievement.
Note: The error bars represent ±1 SD.
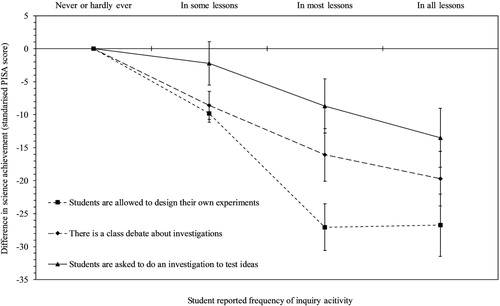
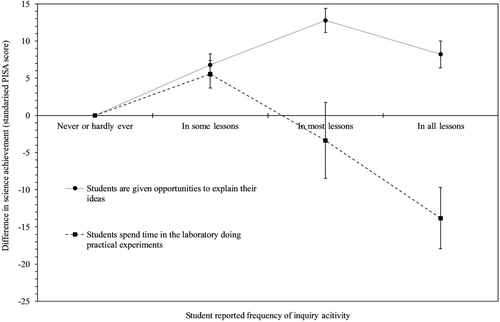
Figure 3. Inquiry-based approaches exhibiting a curvlinear relationship to achievement.
Note: The error bars represent ±1 SD.