
Figures & data
Table 1. Intervention activities undertaken in six schools (A to F) during the study period between 2015 and 2017.
Figure 1. Tracked cohorts and comparison group.
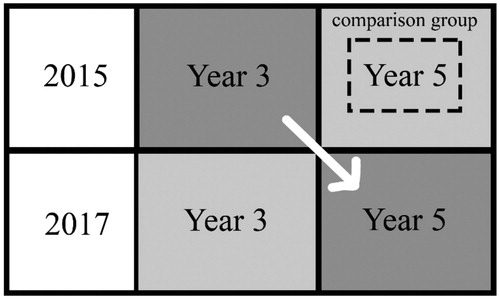
Table 2. Job titles used for the sorting activity.
Figure 2. Sample of a sorted response from a participant.
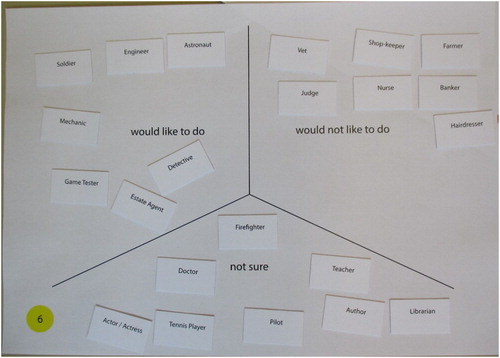
Table 3. Percentages of all participants, Year and Year 5 participants, reporting that they knew a job in 2015 and 2017.
Table 4. Differences in jobs known by gender for all participants.
Table 5. Percentages of all participants’ preferences for jobs including Core STEM jobs (bold) and general STEM jobs (italics). * Χ2 tests had 2 degrees of freedom.
Table 6. Percentages of participants’ preferences for STEM jobs in year 5 comparison and intervention groups (Chi Square Test) *X2 tests had 2 degrees of freedom.
Table 7. Percentages of participants’ preferences with statistically significant differences between intervention and comparison groups by gender (Chi Square Test) *X2 tests had 2 degrees of freedom.
Supplemental material