
Figures & data
Table 1. Description of the phases of the 5E model (from Bybee et al., Citation2006).
Table 2. Distribution of students (n) by group, grade, and year.
Figure 1. Percentage of correct answers of the pre- and post-test in 3rd grade students.
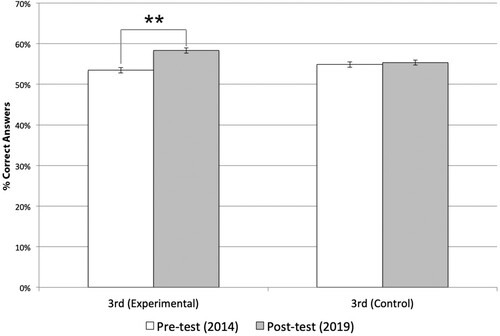
Figure 2. Percentage of correct answers of the pre- and post-test in 4th grade students.
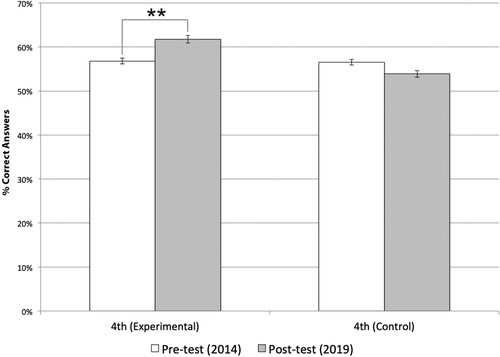
Table 3. Percentage of correct answers of the pre- and post-test in 3rd grade students (experimental vs. control).
Table 4. Percentage of correct answers of the pre- and post-test in 4th grade students (experimental vs. control).