
Figures & data
Figure 1. The percent of AI/AN students in the United States earning STEM degrees between 2008 and 2014 (National Center for Education Statistics, Citation2016).
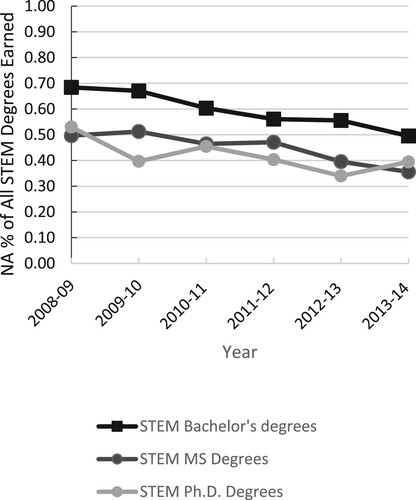
Table 1. Descriptive characteristics among Indigenous STEMM students and professionals, 2019.
Table 2. Perspectives of Cultural, Spiritual, and Ethical Considerations in STEMM among Indigenous STEMM students and professionals, 2019.
Table 3. Level of agreement on a Likert Scale of cultural, spiritual, and ethical impact in STEMM fields among Indigenous STEMM students and professionals, 2019.
Supplemental material