Figures & data
Table 1. Outline of course content and collected data.
Table 2. Self-reported participant backgrounds.
Figure 1. Analytical framework for design conversations.
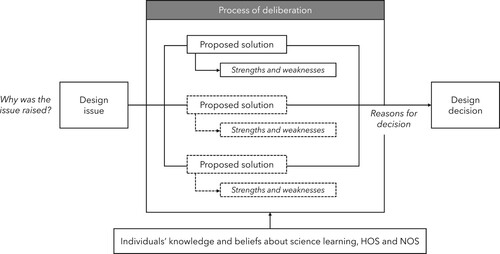
Figure 2. Original data from Boyle’s experiment used in Group 1’s lesson (Conant, Citation1957, p. 64).
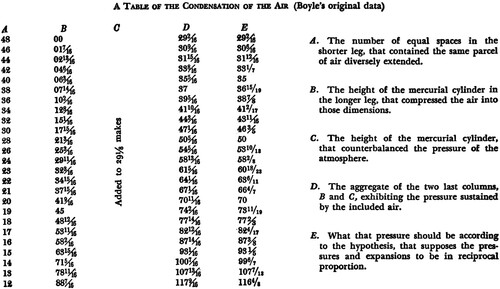
Table 3. Overview of developed lessons (summarised by authors).
Figure 3. Group 2’s role cards for the role play about nuclear weapons during World War II.
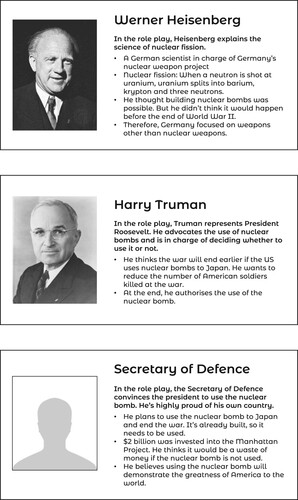
Table 4. Summary of design issues that emerged during lesson planning.
Figure 4. Group 1’s lesson planning process over the semester.
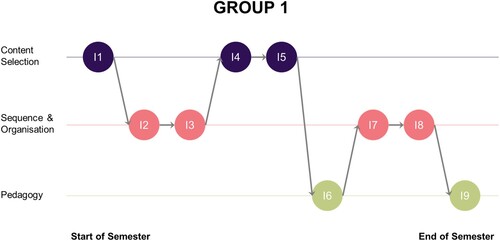
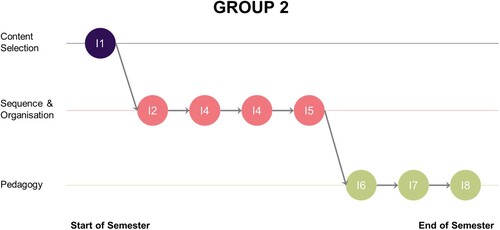
Figure 5. Group 2’s lesson planning process over the semester.