Figures & data
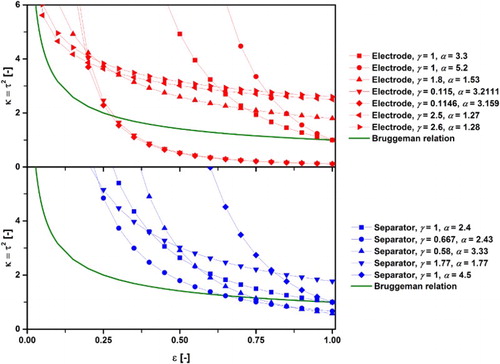
Table 1. Comparison of Bruggeman exponent and scaling parameter for battery layers fitted to experimental results.
Table 2. Tortuosity values for pore, Ni and YSZ phase of an SOFC anode calculated using the random walk method and LBM [Citation103].
Table 3. Tortuosity values for graphite and pore phase using the random walk method and finite volume method [Citation137].
Table 4. Comparison of tortuosity values along each dimension for pore phases of porous membranes calculated using flux-based algorithms.
Table 5. Comparison of tortuosity values along each dimension for pore phases of porous membranes calculated using geometric-based algorithms.

![Figure 4. Comparison of experimental- and image-based tortuosity values at different temperatures and for varying H2 concentrations in N2 reproduced with permission from Elsevier [Citation72].](/cms/asset/2cc7b752-c68d-4e86-96fe-65037ad6bfec/yimr_a_1249995_f0004_c.jpg)
![Figure 6. Geometric tortuosity distribution of the pore phase of the LiCoO2 battery cathode of yz (A), xz (B) and xy (C) planes reproduced with permission from Elsevier [Citation114].](/cms/asset/5909e5b4-aa5d-4ec7-997c-d27556d73606/yimr_a_1249995_f0006_c.jpg)
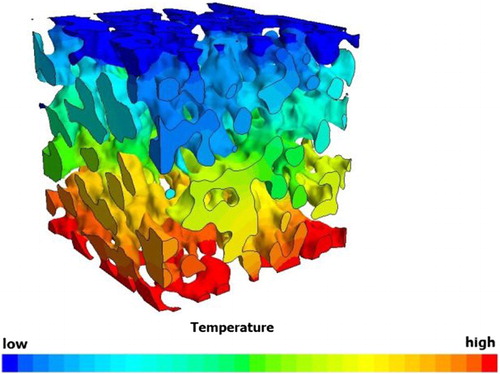
![Figure 8. Results of the TauFactor solver by Cooper [Citation118] running across the pore phase of a porous sample showing the binary image map, the initial, linear concentration distribution and the concentration distribution at steady state.](/cms/asset/deb54b91-3062-4ece-a4c1-229858c4301f/yimr_a_1249995_f0008_c.jpg)
![Figure 9. RVE analysis of the tortuosity factor for the pore and LSCF phase of an SOFC cathode as function of electrode thickness reproduced with permission from Elsevier [Citation147].](/cms/asset/6d70346c-57f0-4f27-84c5-46731fd54674/yimr_a_1249995_f0009_c.jpg)