
Figures & data
Table 1. Primer sequences for RT-PCR.
Table 2. Compounds in CDD with OB larger than 30% and DL larger than 0.18, which combined with the results of UHPLC-Q/TOF-MS.
Figure 1. Changes of estrous cycle in PCOS rat models (HE staining, magnification ×40). A: estrous cycle in control rats (n = 3). B: estrous cycle in PCOS rats (n = 3). Scale bar: 100 μm.
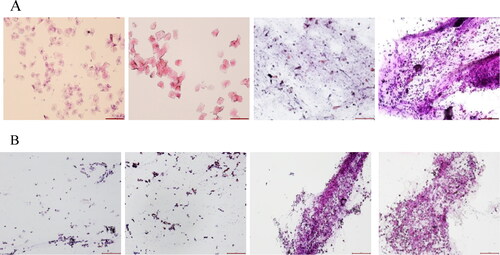
Figure 2. HE staining was used to evaluate the histological morphology of ovarian tissues (magnification ×100). A: Control group (n = 3). B: PCOS group (n = 3). C: CDD group (n = 3). D: Metformin group (n = 3). E: IWR group (n = 3). Scale bar: 1mm.
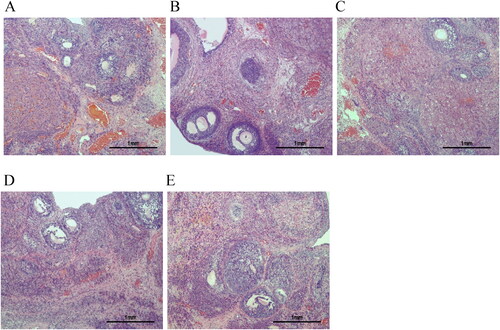
Figure 3. Effect of CDD on body weight, blood glucose, and serum hormones in PCOS rats. A: body weight. B: blood glucose. C: serum hormones levels including FSH, LH, and T. Data are shown as means ± SD (n = 10), and data between multiple groups were compared by one-way ANOVA. Compared with the normal group, *p < 0.05; compared with the PCOS group, △p < 0.05; compared with the metformin group, #p < 0.05.
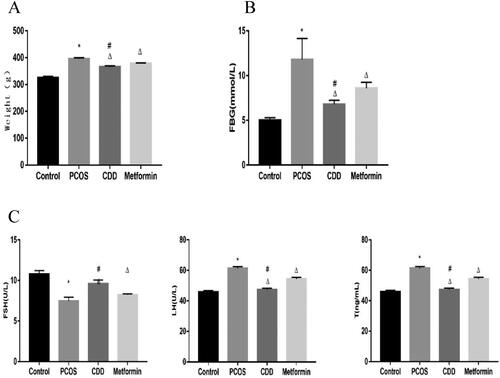
Figure 4. Characteristics of chemical components in CDD by UHPLC-Q/TOF-MS analysis. A: positive ion mode. B: negative ion mode.
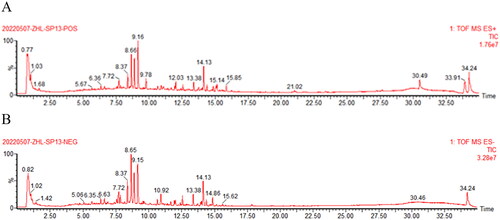
Figure 5. Active compound of CDD target PCOS and PPI network analysis. A: Venn diagram of drug-disease targets. B: The PPI analysis of 56 overlapping targets of CDD and PCOS.
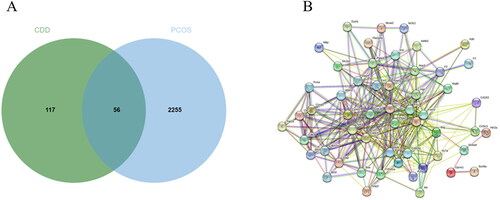
Figure 6. GO enrichment and KEGG pathways analysis for drug-disease targets. A: The top 20 significant GO enrichment analyses. B: The Wnt signaling pathway.
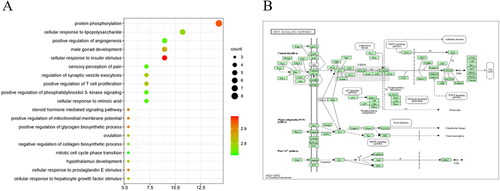
Figure 7. Effect of CDD on the Wnt/β-catenin signaling pathway, autophagy, apoptosis, and proliferation proteins in the ovarian tissue of PCOS rats. A: The image of western blot band. B: The expression of proteins including Wnt-1, β-Catenin GSK-3β, C-MYC, Beclin1, LC3II, Bax, and PCNA. Data are shown as means ± SD (n =3), and data between multiple groups were compared by one-way ANOVA. Compared with the normal group, *p < 0.05; compared with the PCOS group, △p < 0.05; compared with the metformin group, #p < 0.05.
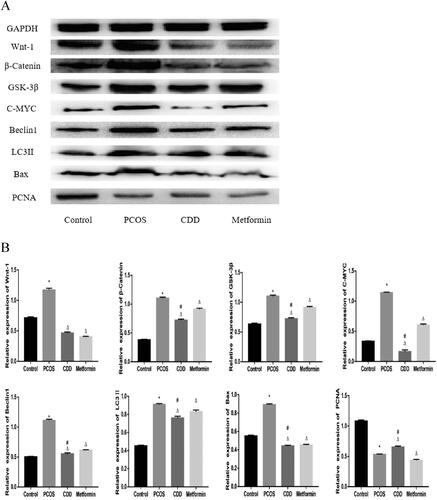
Figure 8. Wnt/β-catenin signaling pathway is involved in regulating autophagy, apoptosis and proliferation in ovarian tissues of PCOS rats. A: The image of western blot band. B: The expression of proteins including Wnt-1, β-Catenin, GSK-3β, C-MYC, Beclin1, LC3II, Bax, and PCNA. Data are shown as means ± SD (n =3), and data between multiple groups were compared by one-way ANOVA. Compared with the normal group, *p < 0.05; compared with the PCOS group, △p < 0.05.
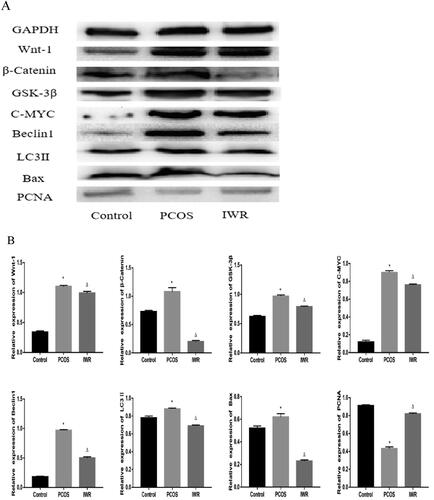
Figure 9. Effect of CDD on the m6A gene in the peripheral blood of PCOS rats. The expression of m6A genes including Mettl3, Mettl14, Fto, Alkbh5, Ythdf1, and Ythdf2. Data are shown as means ± SD (n =10), and data between multiple groups were compared by one-way ANOVA. Compared with the normal group, *p < 0.05; compared with the PCOS group, △p < 0.05; compared with the metformin group, #p < 0.05.
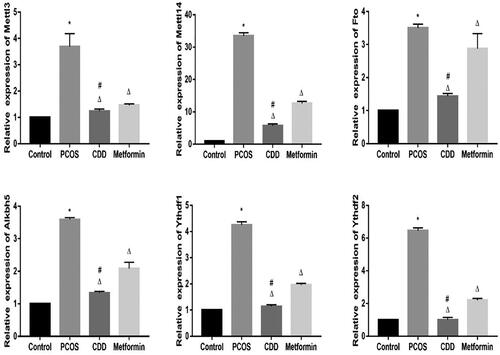
Figure 10. Effect of CDD on the m6A gene in the ovarian tissue of PCOS rats. The expression of m6A genes including Mettl3, Mettl14, Fto, Alkbh5, Ythdf1, and Ythdf2. Data are shown as means ± SD (n =10), and data between multiple groups were compared by one-way ANOVA. Compared with the normal group, *p < 0.05; compared with the PCOS group, △p < 0.05; compared with the metformin group, #p < 0.05.
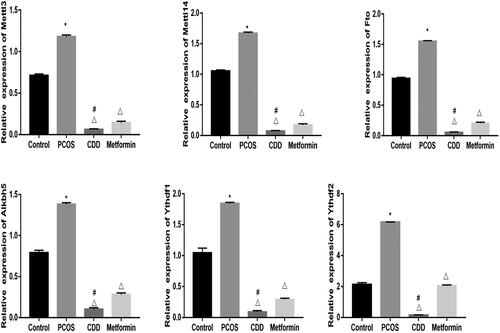
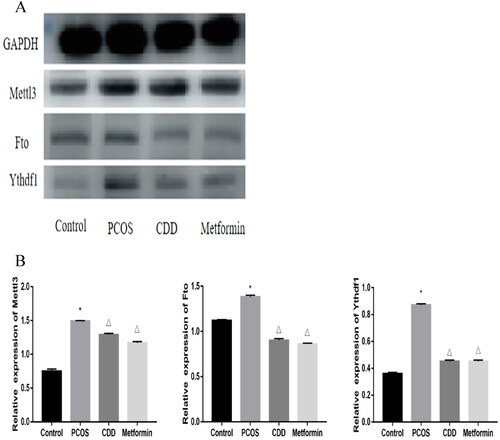
Figure 11. Effect of CDD on the m6A proteins in the ovarian tissue of PCOS rats. A: The image of western blot band. B: The expression of proteins including Mettl3, Fto, and Ythdf1. Data are shown as means ± SD (n =3), and data between multiple groups were compared by one-way ANOVA. Compared with the normal group, *p < 0.05; compared with the PCOS group, △p < 0.05.
Supplemental Material
Download Zip (60.6 KB)Availability of data and materials
The data and materials used to support the findings of this study are available from the corresponding author upon request.