Figures & data
Figure 1. Experimental protocols for PCOS model and ISO treatment (A), chemical structure of ISO (B), and the representative pictures of ovarian tissues after H&E staining (scan bar = 400 μm) (C). CL, corpus luteum; AF, antral follicle; CF, cystic follicles; PF, primary follicle; PoF, preovulatory follicle.
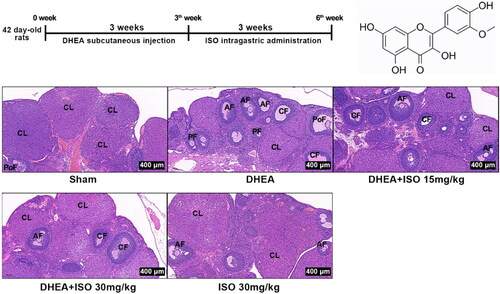
Table 1. The blood glucose and serum levels of hormones after DHEA treatment at third week.
Table 2. The serum levels of hormones at sixth week.
Table 3. The body weight, ovary weight, and ovary volume of rats.
Table 4. The levels of TNF-α, IL-1β, IL-6, and IL-18 in ovary tissue homogenate at sixth week.
Figure 2. The representative pictures of apoptosis of ovarian tissues (scan bar = 100 μm) (A), and the protein expression of Bcl-2, Bax, and c-caspase-3 in ovarian tissues (B).
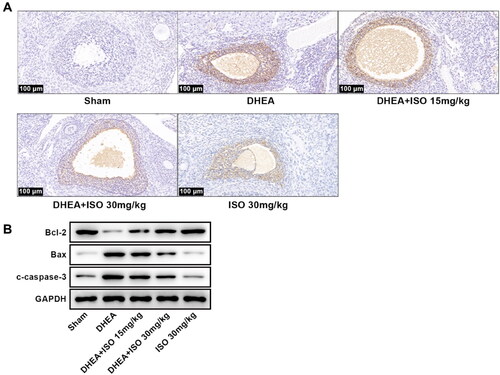
Table 5. The relative expression of apoptosis-related proteins and TNF signaling pathway related proteins in ovary tissue at sixth week.
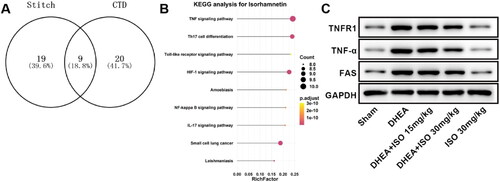
Figure 3. The proteins interacted with ISO (A), signaling pathways affected by ISO (B) and protein expression of TNFR1, TNF-α, and FAS in ovarian tissues (C).