
Figures & data
Figure 1. Patient inflow diagram of the research.
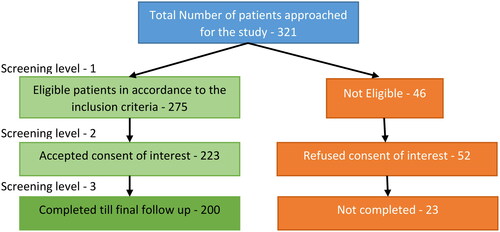
Table 1. Description of ovarian reserve parameters evaluated in the analysis.
Table 2. Physical parameter analysis.
Figure 2. FSH levels of subfertile women in comparison with BMI and age (years).
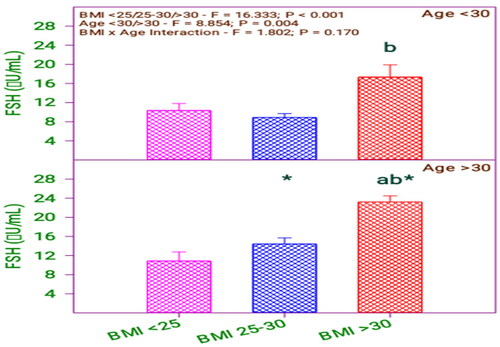
Table 3. Follicular stimulating hormone (FSH) levels of subfertile women in comparison with body mass index (BMI) and age (years).
Figure 3. AMH levels of subfertile women in comparison with BMI and age (years).
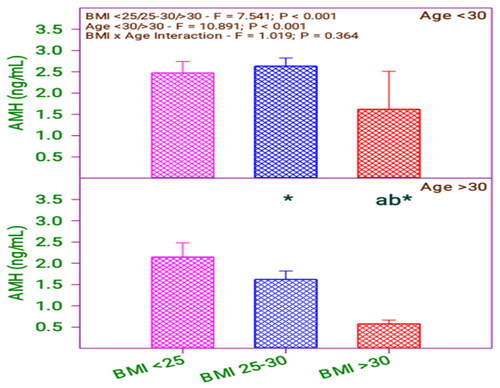
Table 4. AMH levels of subfertile women in comparison with BMI and age (years).
Figure 4. Day 2-AFC of subfertile women in comparison with body mass index (BMI) and age (years).
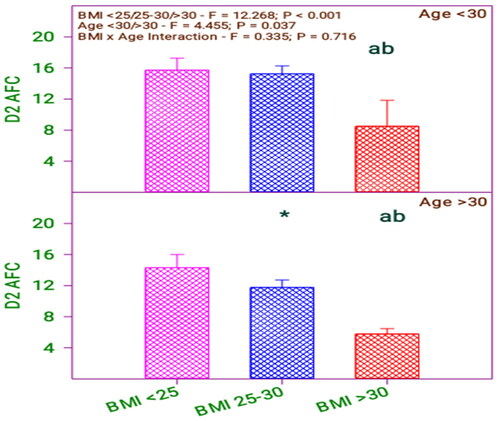
Table 5. Day 2-AFC of subfertile women in comparison with BMI and age (years).
Figure 5. Serum E2 levels of subfertile women in comparison with body mass index (BMI) and age (years).
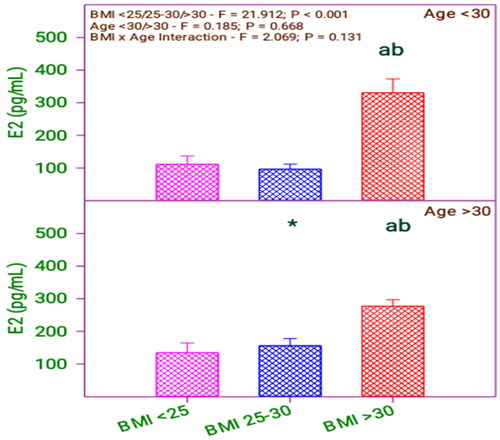
Table 6. Serum E2 levels of subfertile women in comparison with BMI and age (years).
Figure 6. Right ovarian volume of subfertile women in comparison with body mass index (BMI) and age (years).
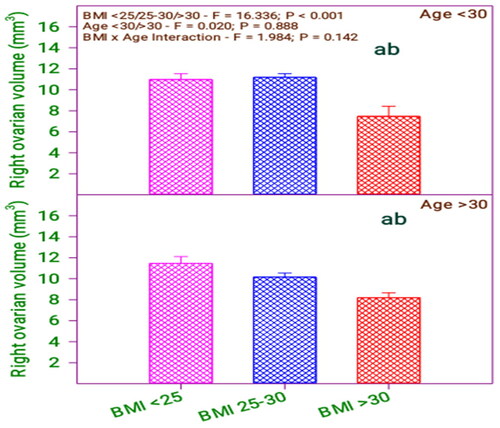
Table 7. Right ovarian volume of subfertile women in comparison with BMI and age (years).
Figure 7. Left ovarian volume of subfertile women in comparison with body mass index (BMI) and age (years).
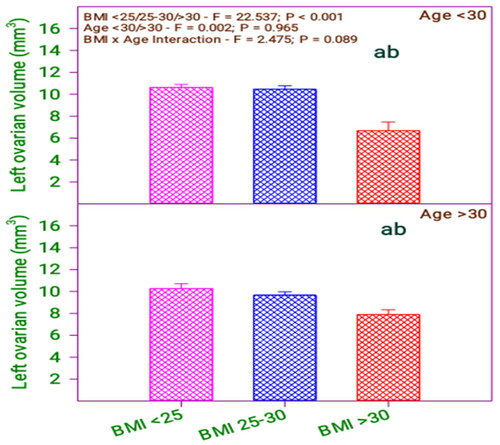
Table 8. Left ovarian volume of subfertile women in comparison with BMI and age (years).
Table 9. Bonferroni t test comparisons of FSH and BMI and age.
Table 10. Bonferroni t test comparisons of AMH and BMI and age.
Table 11. Bonferroni t test comparisons of Day-2 AFC and BMI and age.
Table 12. Bonferroni t test comparisons of serum E2 level and BMI and age.
Table 13. Bonferroni t test comparisons of right ovarian volume and BMI and age.
Table 14. Bonferroni t test comparisons of left ovarian volume and BMI and age.