Figures & data
Figure 1. ALT time-dependently induces human platelet apoptosis. Washed human platelets were incubated with ALT (5 μM) or vehicle control (DMSO) at 37°C for 4 h, 8 h or 12 h, and platelet apoptosis was detected at different time points. (a) ΔΨm depolarization was detected and quantitatively analyzed by flow cytometry. (b-d) Caspase-3 activity was evaluated using western blot analysis (b), and the densitometric analyses of the immunoblots for full caspase-3 (c) and cleaved caspase-3 (d) were performed. (e) PS exposure was measured by flow cytometry. Data presented are from three independent experiments and expressed as the mean ± SD; * p < .05, ** p < .01, and *** p < .001 versus the control with a two-tailed Student’s t-test.
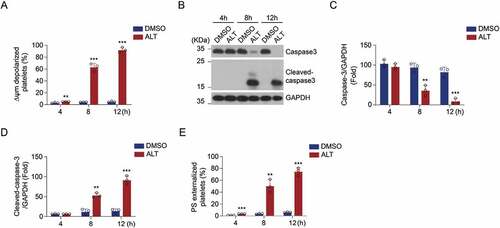
Figure 2. ALT dose-dependently induces human platelet apoptosis. Washed human platelets were incubated with the indicated concentrations of ALT (2.5 μM, 5 μM and 10 μM) or vehicle control (DMSO) at 37°C for 8 h, and platelet apoptosis was measured. (a) ΔΨm depolarization was detected and quantitatively analyzed by flow cytometry. (b) Caspase-3 activity was evaluated using western blot analysis, and the densitometric analysis of the immunoblot for cleaved caspase-3 was performed. (c) PS exposure was detected and calculated by flow cytometry. Data presented are from three independent experiments and expressed as the mean ± SD; * p < .05, ** p < .01, and *** p < .001 versus the control with one-way ANOVA.
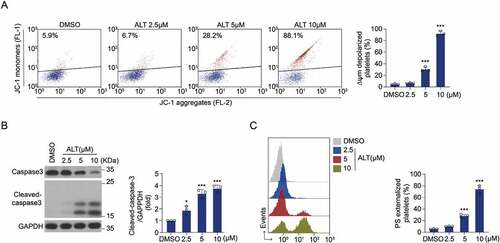
Figure 3. Akt activity is improved by ALT and ALT-induced apoptosis is diminished in Akt-deficient platelets. (a–c) Washed human platelets were incubated with the indicated concentrations of ALT (2.5 μM, 5 μM, and 10 μM) or vehicle control (DMSO) at 37°C for 8 h. The activity of Akt was measured by the western blot analysis (a), and a histogram showing the relative normalized expression of p-Akt Ser473 (b) and Thr308 (c) was constructed. (d-f) Washed WT and Akt-/- murine platelets were incubated with ALT (5 μM) or vehicle control (DMSO) at 37°C for 8 h. Akt deletion of mice was confirmed by PCR (d), while ΔΨm depolarization (e) and PS exposure (f) were assessed by flow cytometry. Data presented are from three independent experiments and expressed as the mean ± SD; * p < .05, ** p < .01 and *** p < .001 versus the control with one-way ANOVA for (a–c) and versus the control with a two-tailed Student’s t-test for (d–f).
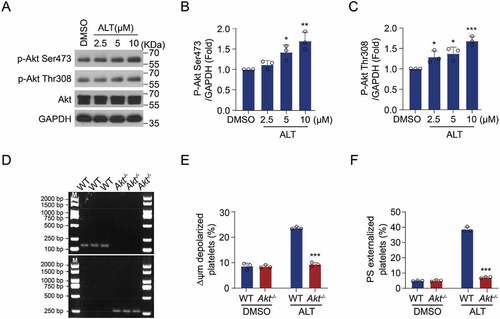
Figure 4. ALT does not induce human platelet activation. (a,b) Washed human platelets were incubated with ALT (5 μM) or vehicle control (DMSO) at 37°C for 4 h, 8 h or 12 h, and platelet activation was measured at different time points. Platelet activation was assessed using CD62P (a) and PAC-1 antibodies (b) by flow cytometry. Data presented are from three independent experiments and expressed as the mean ± SD. (c–f) Washed human platelets were incubated with ALT (5 μM, 10 μM) or vehicle (DMSO) at 37°C for 4 h, and then were stimulated with indicated concentrations of U46619 (c), collagen (d), Trap6 (e), and ADP (f) at 37°C under constant stirring. Platelets aggregation was monitored using a CHRONO-LOG aggregometer. Histograms of maximal platelets aggregation under the indicated conditions are shown as mean ± SD of three independent experiments. * p < .05, ** p < .01, *** p < .001 and ns (not significant) versus the control with a two-tailed Student’s t-test for (a,b) and versus control group with two-way ANOVA prior to Bonferroni post hoc test for (c–f).
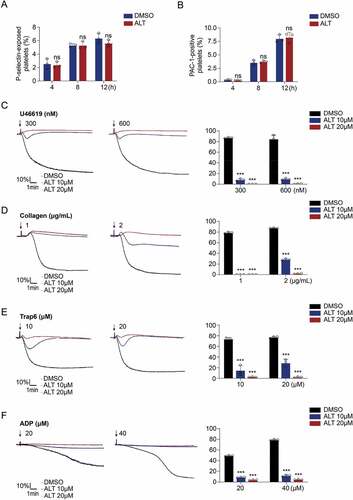
Figure 5. ALT reduces platelet PKA activity and PKA activation rescues platelet from ALT-induced apoptosis. (a–d) Washed human platelets were incubated with the indicated concentrations of ALT (2.5 μM, 5 μM and 10 μM) or vehicle control (DMSO) at 37°C for 8 h. The activity of PKA was evaluated using western blot analysis (a), with phosphorylated VASP Ser157 (b) and Bad Ser155 (c). The expression of classical apoptosis-related proteins, p-P53, Bcl-xL, Bak and Bax, were detected with various primary antibodies via western blot analysis (d). (e–j) Washed human platelets were pre-treated with different concentrations of PKA activator forskolin (FSK) (2.5 μM, 5 μM and 10 μM) or vehicle control (DMSO) at 37°C for 10 min followed by incubation with 5 μM ALT at 37°C for 8 h. PKA activity was measured using western blot analysis (e), with the phosphorylation of VASP at Ser157 (f) and Bad at Ser155 (g); caspase-3 was also evaluated with western blot analysis (h). Platelet ΔΨm depolarization (i) and PS exposure (j) were detected by flow cytometry. (k–m) Washed platelets from the WT or Bad−/− mice were incubated with 5 μM ALT or vehicle control (DMSO) at 37°C for 8 h. The deficiency of Bad in platelets was examined using western blot analysis (k); Platelet ΔΨm depolarization (l) and PS exposure (m) were detected by flow cytometry. Data presented are from three independent experiments and expressed as the mean ± SD; * p < .05, ** p < .01, and *** p < .001 versus the control with one-way ANOVA for (a–j) and versus the control with a two-tailed Student’s t-test for (k–m).
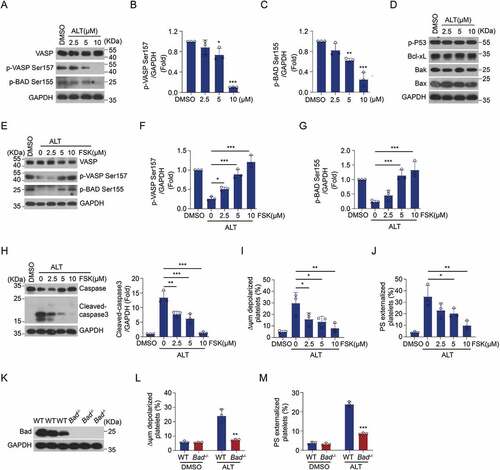
Figure 6. Selective inhibition of the PI3K/Akt/PDE3A signaling pathway reverses ALT-induced PKA suppression and platelet apoptosis. Washed human platelets were pre-treated with PI3K inhibitors (20 μM Ly294002 and 100 nM Wortmannin) (a–d), Akt inhibitors (2 μM Akti VIII and 6 μM MK2206) (e–h), PDE3A inhibitors (10 μM Milrinone and 10 μM Cilostazol) (i–l) or vehicle control (DMSO) at 22°C for 10 min and then incubated with 5 μM ALT at 37°C for 8 h. The phosphorylation of VASP at Ser157 and caspase-3 activity were evaluated using western blot analysis; ΔΨm depolarization and PS exposure of platelets were detected by flow cytometry. Data presented are from three independent experiments and expressed as the mean ± SD; * p < .05, ** p < .01, and *** p < .001 versus the control with a two-tailed Student’s t-test.
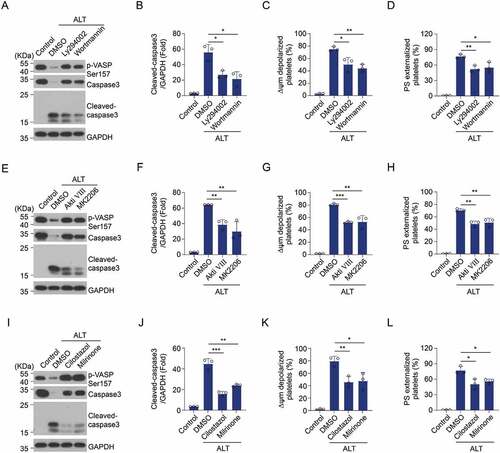
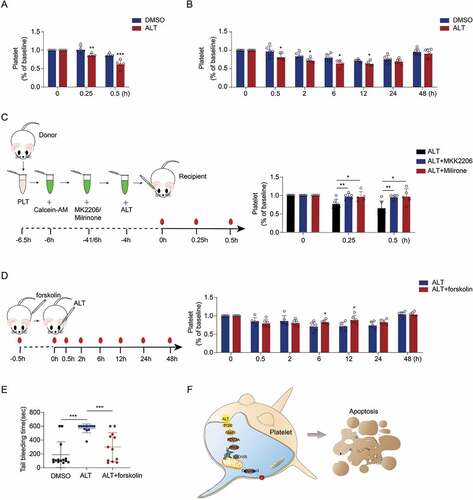
Figure 7. ALT accelerates apoptosis-dependent platelet clearance and reduces the count of platelets in circulation. (a) Calcein-labeled murine platelets were incubated with 5 μM ALT or vehicle control (DMSO) at 37°C for 4 h and then transfused into WT mice; n = 6 for each group. The baseline is the percentage of calcein-positive platelets in circulation tested immediately after platelet infusion. (b) C57BL/6J mice were i.v. injected with 2 mg/kg ALT or vehicle control (DMSO) and platelet counts were determined at the indicated time points; n = 6 for each group. The baseline is defined as the platelet count before ALT injection. (c) Calcein-labeled murine platelets were pre-treated with 10 μM milrinone, 10 μM cilostazol or vehicle control (DMSO) at 37°C for 10 min and then incubated with 5 μM ALT at 37°C for 4 h. These platelets were then transfused to C57BL/6J mice and the percentage of calcein-positive platelets remaining in circulation was evaluated at the indicated time points by flow cytometry; n = 6 for each group. The baseline is defined as the percentage of calcein-positive platelets in circulation tested immediately after transfusion. (d) C57BL/6J mice were i.v. injected with 5 mg/kg PKA activator forskolin or vehicle control (DMSO) for 30 min and were then i.v. injected with 2 mg/kg ALT. Platelet counts were then detected at the indicated time points; n = 6 for each group. The baseline is defined as the platelet count before the ALT injection. (e) C57BL/6J mice were i.v. injected with 5 mg/kg PKA activator forskolin or vehicle control (DMSO) for 30 min and were then i.v. injected with 2 mg/kg ALT. Tail bleeding time was recorded to cessation of bleeding in response to tail injury. (f) Schematic illustration of ALT-induced platelets apoptosis: the ALT initiates Akt activation, the downstream effector of PI3K, and then Akt activates PDE3A, leading to PKA inhibition and Bad release from the combination with Bcl-xL. Released Bad induces caspase-3 mediated apoptosis leading to PS externalization. Data presented are the mean ± SD; * p < .05, ** p < .01, and *** p < .001 versus the control with two-way ANOVA prior to the Bonferroni post-hoc test for (a–d) and versus the control with a two-tailed Student’s t-test for (e).