Figures & data
Figure 1. CETSA of platelet proteins. (A) schematic of the CETSA process; see main text for further details of each step. (B) Thermal shift curves for the indicated proteins were derived from Western blotting of the soluble protein fraction following heating to the indicated temperature. For each protein represented, N ≥ 4 platelet preparations from independent donors (mean ±S.E.M.) (C) Representative Western blots of the proteins screened.
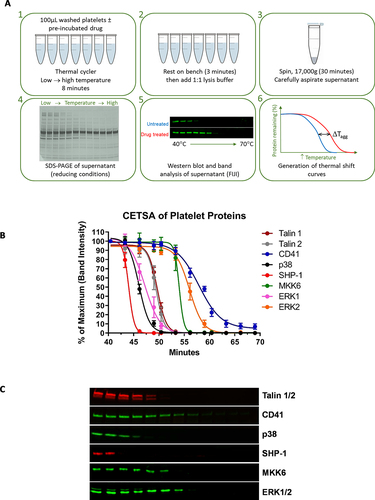
Table I. Tagg values with 95% confidence intervals of initial platelet proteins tested.
Figure 2. Activation and CETSA of p38. Platelets were activated using the Ca2+ ionophore, A23187. (A) Platelet activation was confirmed by P-selection surface expression (as a marker of α-granule secretion) and p38 phosphorylation (Pp38 = phospho-p38). (B) CETSA was conducted on A23187-treated and unstimulated platelets. Thermal stability curves showing soluble p38 at each temperature, and representative Western blots, are shown. (C) CETSA of p38 pre-incubated with the p38-specific inhibitor SB239063 and the MKK6 inhibitor Gossypetin (both 10 µM). The untreated sample contains an equivalent volume of the solvent, DMSO. (D) ITDR CETSA of p38 vs. SB239063 at 50°C. For all panels, values shown are the means ±S.E.M (N = 4).
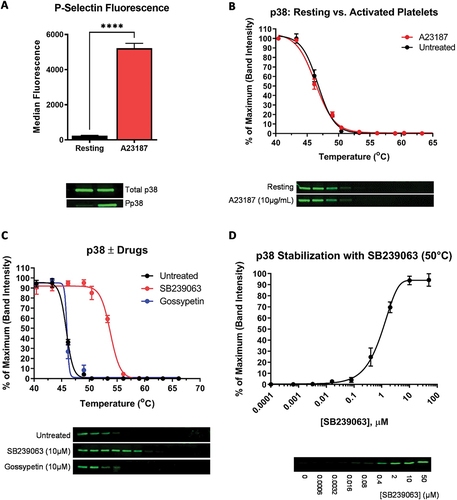
Figure 3. CETSA of ERK1 & ERK2. (A) CETSA of ERK1 and ERK2 pre-incubated with the ERK1/2-specific inhibitor Ulixertinib or the p38 inhibitor SB239063 (10 µM). The untreated sample contains an equivalent volume of the solvent, DMSO. Representative blots are shown. (B) ITDR CETSA of ERK1 and ERK2 vs. Ulixertinib at 50°C and 59°C, respectively. Platelets were treated with the indicated concentrations of Ulixertinib prior to heating. For all panels, values shown are the means ±S.E.M (N = 4).
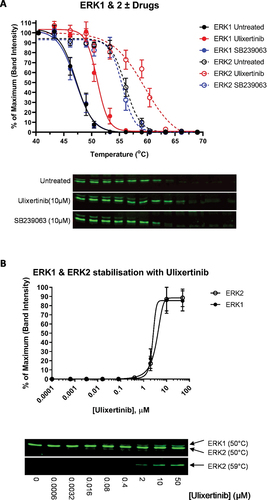
Figure 4. Tagg moderately correlates with protein hydrophobicity. Tagg of all platelet proteins tested in are plotted against (A) molecular weight; (B) Aliphatic index; (C) Unstability rating; and (D) Hydrophobicity. The Pearson correlation coefficient (r) is shown on each plot. Each protein represented is the mean value from N ≥ 4 separate donors.