
Figures & data
Figure 1. Categorisation of studies reporting the application of opportunity management enablers.

Table 1. Selected cases and assigned case numbers.
Figure 2. Project phases in which the enablers were applied, and the project delivery models.
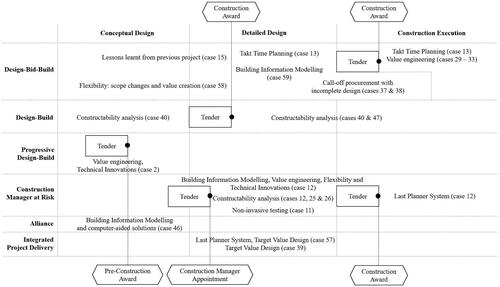
Table 2. Observed enablers applied in the selected cases, along with observed types of expected and actual positive effects, and contracting parties that used the enablers (N = number of projects).
Table 3. Application timing of enablers, sorted by general project phases (X = at least one observation of enabler utilisation during the project phase).
Table 4. Approximated size of quantified first-order effects relative to the project cost, project baseline schedule or costs of the associated parts of the project scope (N = number of projects).
Table 5. Quantified second-order effects of enablers.