Figures & data
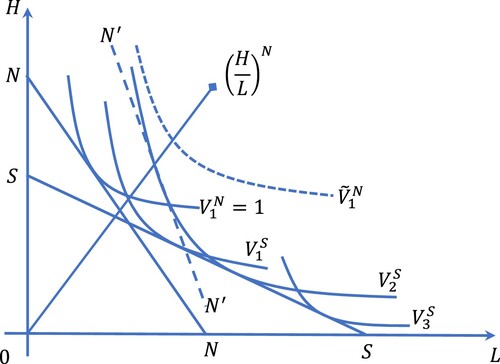
Figure 1. The Lerner-Pearce diagram.
Source: Own elaboration based on Leamer (Citation1995).
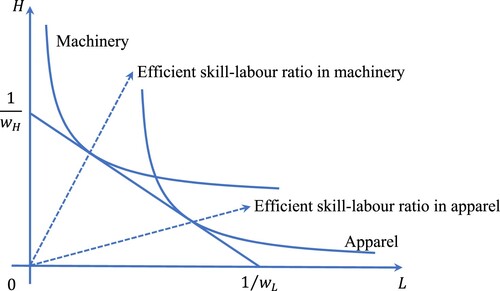
Figure 2. North and South isocosts lines under autarky.
Source: Own elaboration.
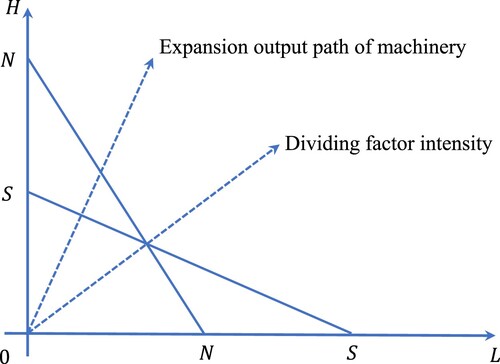
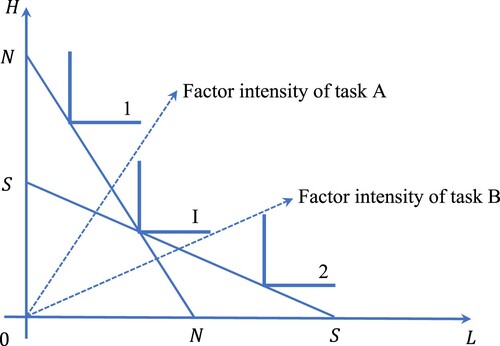
Figure 3. Break down of a finished good’s factor-input coefficient.
Source: Own elaboration.
Figure 4. Free trade equilibrium without fragmentation.
Source: Own elaboration based on Jones and Kierzkowski (Citation2001).
Table
Table
Figure 5. Trade pattern reversal with trade in intermediate inputs and free capital mobility.
Source: Own elaboration based on Deardorff (Citation1979).