890
Views
5
CrossRef citations to date
0
Altmetric
ARTICLES

The production of anti-Vibrio harveyi egg yolk immunoglobulin and evaluation of its stability and neutralisation efficacy

, , &
Pages 279-294 | Received 05 Oct 2011, Accepted 07 Apr 2012, Published online: 14 May 2012

Figures & data

Table 1. Immunisation program including four treatments (three hens each).
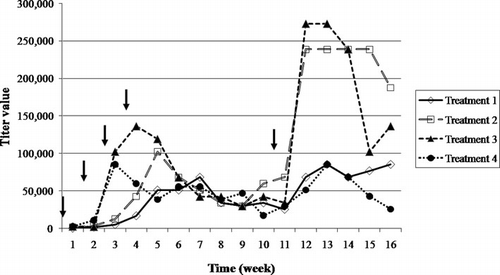
Figure 1. The kinetics of anti-V. harveyi antibody titres from egg yolk during the immunisation period. Arrows indicate weeks of immunisation.
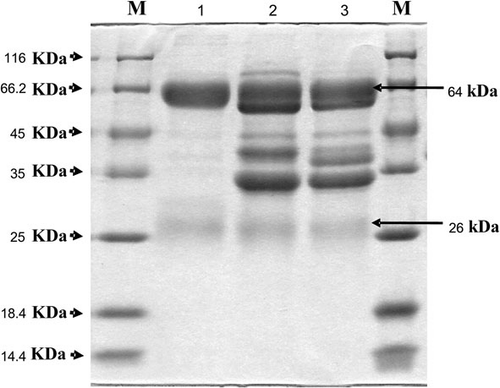
Figure 2. SDS-PAGE of crude IgY prepared from egg yolk. M: standard protein markers; lane 1: IgY standard (Promega, USA); lane 2: IgY from salting out method; lane 3: IgY from freeze drying method.
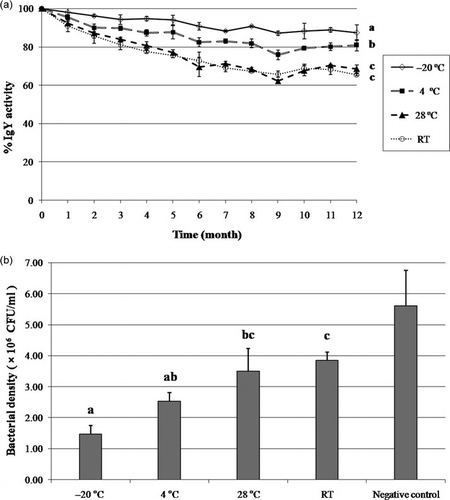
Figure 3. (a) The IgY activity at different storage temperatures. IgY was stored at −20, 4, 28°C and room temperature after 12 months. Each value is the average of three determinations. The activity was measured with the ELISA (OD 405 nm). Error bars represent standard error of mean (SEM). Groups with different letters are significantly different (P<0.01). (b) The efficiency of IgY on growth inhibition of V. harveyi after storage at −20, 4, 18°C and room temperature (RT) for 12 months compared to the negative control which 1.5% NaCl was replaced the IgY. The viable cells were counted by plate count method. Values are mean of triplicate samples. Error bars represent SEM. Groups with different letters are significantly different (P<0.05).
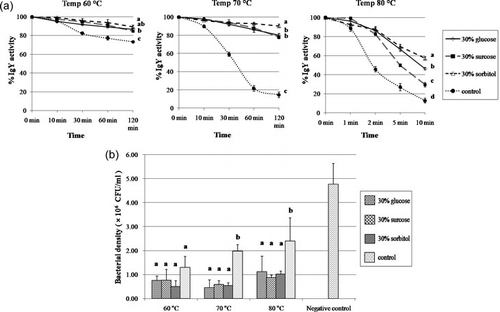
Figure 4. (a) The IgY activity in the presence of different sugars. IgY was thermally treated at 60, 70 and 80°C for diverse time periods. Non-supplemented IgY was used as a control. Each represented value denotes the average of three determinations as determined by the application of ELISA (OD 405 nm). Error bars represent SEM. Groups with different letters are significantly different (P<0.01). (b) The efficiency of IgY (in the present of different sugars) on the growth inhibition of V. harveyi after thermally treated at 60, 70 and 80°C compared to the negative control which 1.5% NaCl was replaced the IgY. The viable cells were counted by plate count method. Values are mean of triplicate samples. Error bars represent SEM. Groups with different letters are significantly different (P<0.05).
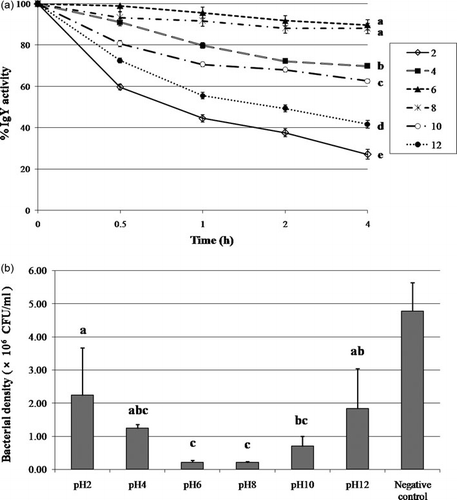
Figure 5. (a) The IgY activity under acidic and basic conditions. The pH of IgY solution was adjusted to 2, 4, 6, 8, 10 and 12, then incubated at 37°C for 4 h. Each reported value represents the average of three replicates attained with ELISA (OD 405 nm). Error bars represent SEM. Groups with different letters are significantly different (P<0.01). (b) The efficiency of IgY on growth inhibition of V. harveyi after the incubation at pH 2, 4, 6, 8, 10 and 12 for 4 h compared to the negative control which 1.5% NaCl was replaced the IgY. The viable cells were counted by plate count method. Values are mean of triplicate samples. Error bars represent SEM. Groups with different letters are significantly different (P<0.05).
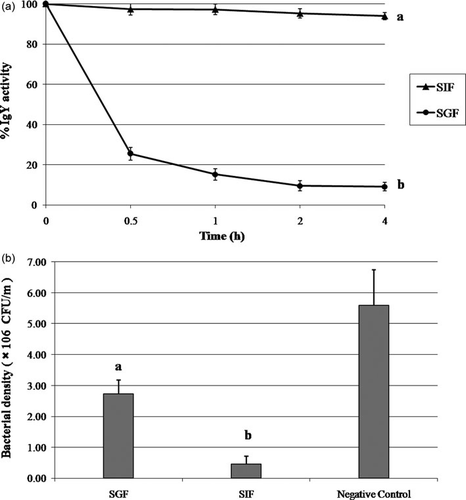
Figure 6. (a) The IgY activity both under simulated gastric conditions (SGF) and simulated intestinal conditions (SIF). The IgY was incubated in SGF or SIF for 4 h. The samples were kept at each time interval and measured by means of ELISA (OD 405 nm). Each value is the average of three determinations. Error bars represent SEM. Groups with different letters are significantly different (P<0.01). (b) The efficiency of IgY on growth inhibition of V. harveyi after the incubation in simulated gastric conditions (SGF) and simulated intestinal conditions (SIF) for 4 h compared to the negative control which 1.5% NaCl was replaced the IgY. The viable cells were counted by plate count method. Values are mean of triplicate samples. Error bars represent SEM. Groups with different letters are significantly different (P<0.05).
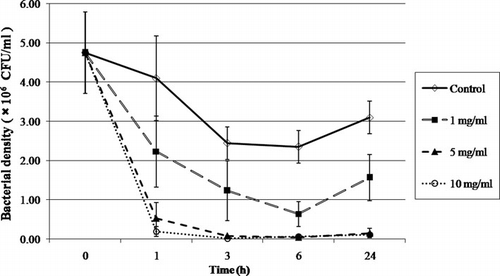
Figure 7. The neutralisation effect of IgY by the growth of V. harveyi on TCBS medium. The live V. harveyi 5×10⁶ CFU/ml were neutralised by 0, 1, 5 and 10 mg/ml of IgY for 24 h. The viable cells were counted by the plate count method at each time interval. Values shown represent the mean of triplicate samples. Error bars represent SEM. Groups with different letters are significantly different (P<0.01).

Reprints and Corporate Permissions

Please note: Selecting permissions does not provide access to the full text of the article, please see our help page How do I view content?

To request a reprint or corporate permissions for this article, please click on the relevant link below:

Academic Permissions

Please note: Selecting permissions does not provide access to the full text of the article, please see our help page How do I view content?

Obtain permissions instantly via Rightslink by clicking on the button below:

If you are unable to obtain permissions via Rightslink, please complete and submit this Permissions form. For more information, please visit our Permissions help page.