Figures & data
Figure 1. Standard curve of (A) ZEN and (B) DON by ELISA (n = 3).
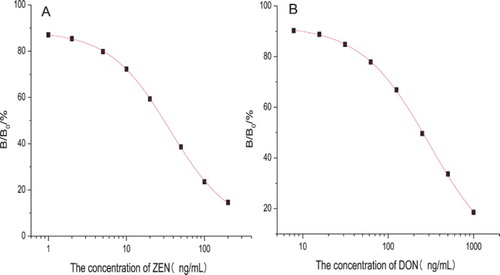
Figure 2. Evaluation of the volume ratio of methanol to acetonitrile on the recovery of ZEN and DON determined by ELISA (n = 3).
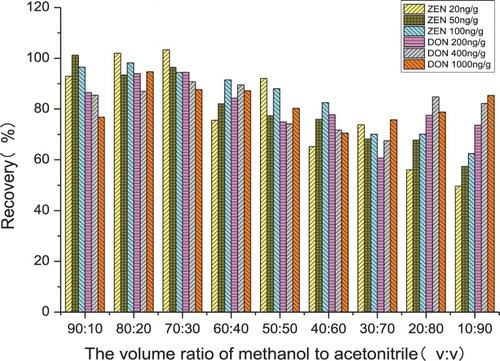
Table 1. Effect of extraction solvents on the recovery of ZEN and DON determined by ELISA (n = 3).
Table 2. Effect of extraction methods on the recovery of ZEN and DON determined by ELISA (n = 3).
Figure 3. Effect of QuEChERS composition on the recovery of ZEN and DON determined by ELISA (n = 3).
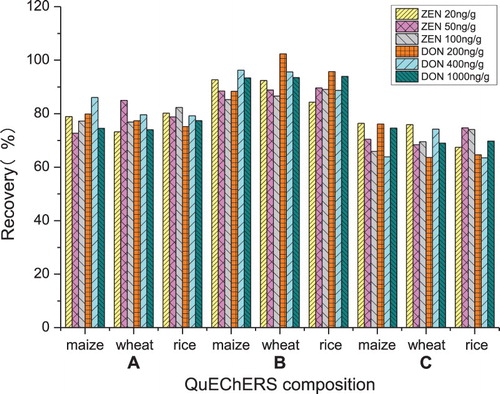
Figure 4. Effect of PSA mass on the recovery of ZEN and DON determined by ELISA (n = 3).
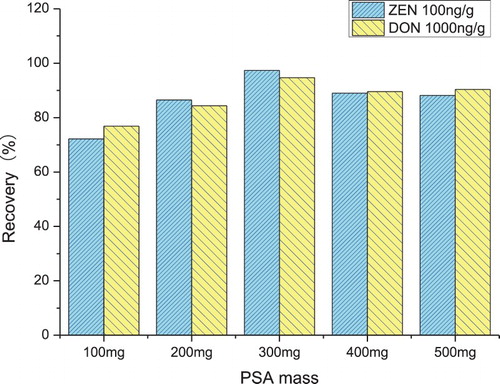
Table 3. Effect of sorbents on the recovery of ZEN and DON determined by ELISA (n = 3).
Figure 5. Effect of clarification time on the recovery of ZEN and DON determined by ELISA (n = 3).
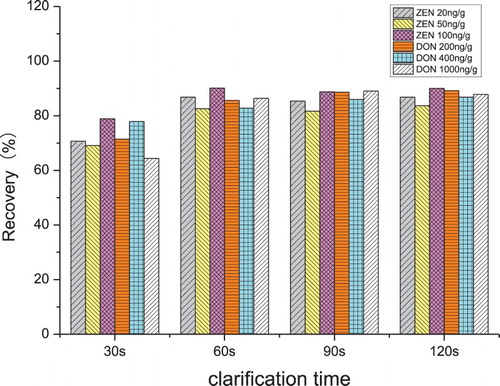
Table 4. The recovery and CV of ZEN and DON determined by ELISA in maize, wheat and rice (n = 3).
Table 5. Specificity of the anti-ZEN mAb and anti-DON mAb.
Figure 6. Competitive curves of PBS and other three extracts distilled from maize, wheat and rice for (a) ZEN and (b) DON under optimised conditions.
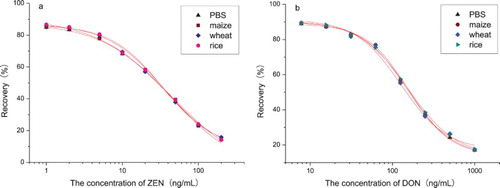
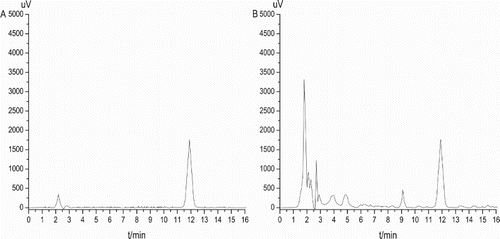
Figure 7. Analysis of ZEN using HPLC–FLD. The chromatogram of ZEN standard solution (100 ng/mL) (A) and an extract of a cereal sample spiked with 100 μg/kg of ZEN (B).
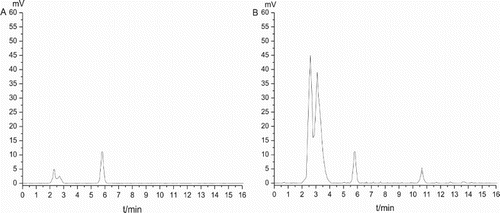
Figure 8. Analysis of DON using HPLC–UVD. The chromatogram of DON standard solution (1000 ng/mL) (A) and an extract of a cereal sample spiked with 1000 μg/kg of DON (B).