Figures & data
Figure 1. Chemical structure of 6-Benzylaminopurine.
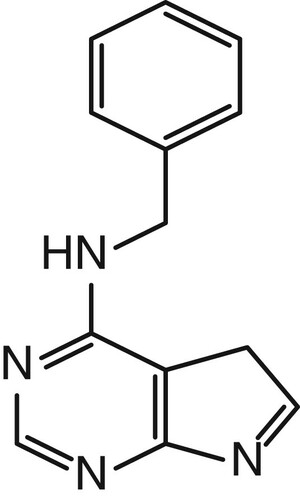
Figure 2. The synthesis route of the hapten 6-BA-COOH.
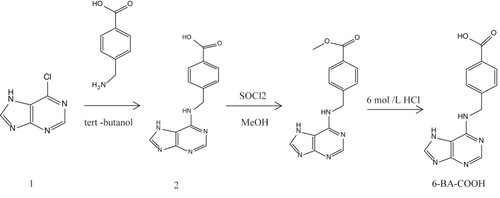
Figure 3. MS spectrum of hapten (6-BA-COOH).
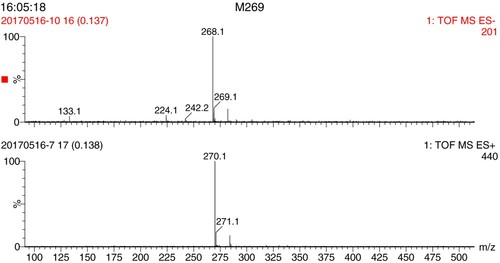
Figure 4. UV–Vis spectra of 6-BA-COOH, proteins and antigens.
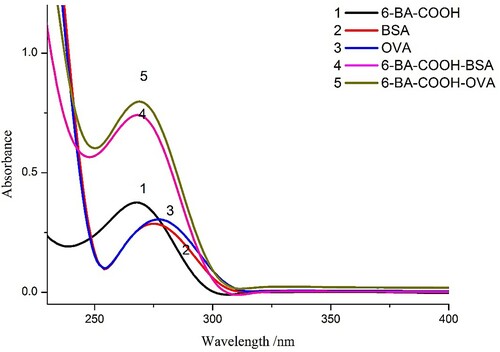
Figure 5. Standard inhibition curve of mAb 3D3 for 6-benzylaminopurine.
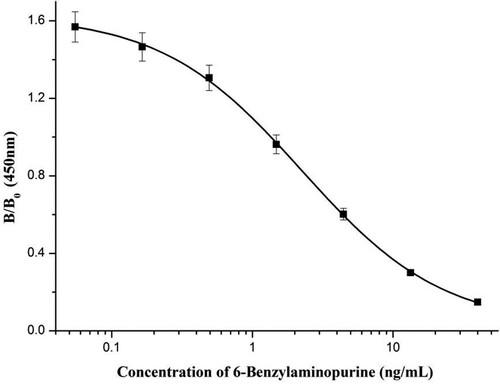
Table 1. Cross-reactivities of 6-BA and related analytes.
Figure 6. Optimization of immunochromatographic strip: (a) coating antigens with different reaction molar ratio of hapten to OVA. Coating 1 = 30:1; coating 2 = 60:1; 1= 0 ng/mL; 2 = 50 ng/mL. (b) Concentration optimized of coating 2. C1 = 0.1 mg/mL; C2 = 0.25 mg/mL; 1 = 0 ng/mL; 2 = 50 ng/mL; 3 = 70 ng/mL, n = 6.
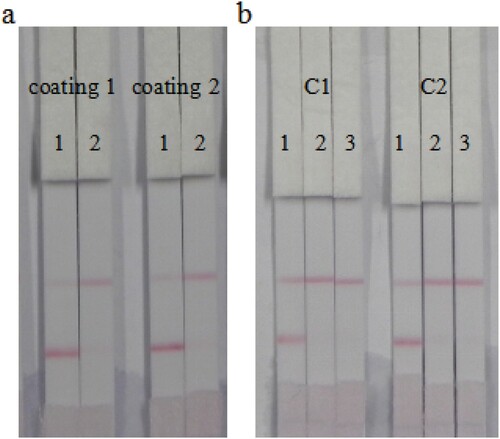
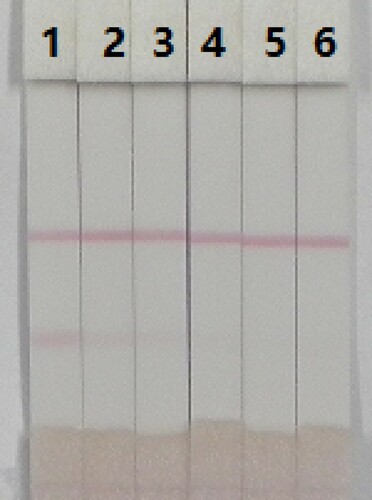
Figure 7. The sensitivity of the immunochromatographic strip (n = 6). 1 = 0 ng/mL; 2 = 2.5 ng/mL, 3 = 5 ng/mL, 4 = 10 ng/mL, 5 = 25 ng/mL, 6 = 50 ng/mL, and 7 = 75 ng/mL.
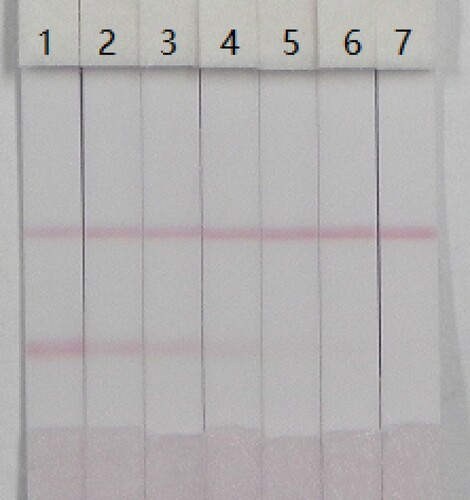
Figure 8. 6-BA detection in bean sprout using the ICA strip (n = 6). 1 = 0 ng/g; 2 = 10 ng/g, 3 = 20 ng/g, 4 = 50 ng/g, 5 = 80 ng/g and 6 = 100 ng/g.