Figures & data
Table 1. Mouse primer sequences used for qRT-PCR.
Figure 1. Impacts of pre-treatment using MgIG (intraperitoneal administration of 50 or 100 mg/kg) for Con A-induced liver damage. (A) MgIG's chemical structure; (B) Serum ALT levels; (C) Serum AST levels; (D) H&E staining of liver tissue; (E) Liver injury score. The data are expressed as mean ± SD (n = 7, ##P < 0.01 versus control; *P < 0.05, **P < 0.01 versus Con A). a: Control; b: Con A; c: Con A + MgIG-50; d: Con A + MgIG-100.
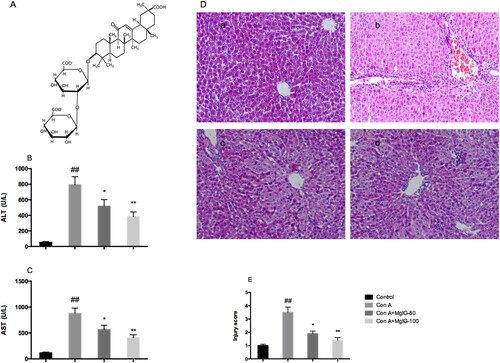
Figure 2. MgIG pre-treatment of mice decreases the release of proinflammatory cytokines in the liver tissue following inducement of Con A (n = 7, ##P < 0.01 versus control; *P < 0.05, **P < 0.01 versus Con A).
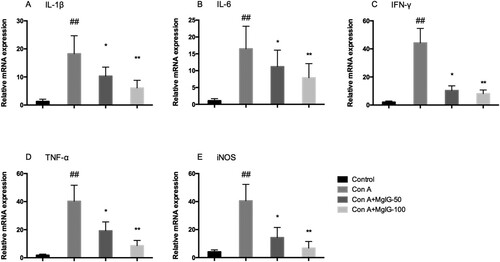
Figure 3. Impact of MgIG on F4/80+ macrophage infiltration in the liver samples of Con A-induced mice. (A) Immunofluorescence assays were used to identify F4/80+ macrophage infiltration; (B) Quantification of F4/80+ macrophages in the mice livers took place for each group. The data are expressed as mean ± SD (n = 7, ##P < 0.01 versus control; *P < 0.05, **P < 0.01 versus Con A). a: Control; b: Con A; c: Con A + MgIG-50; d: Con A + MgIG-100.
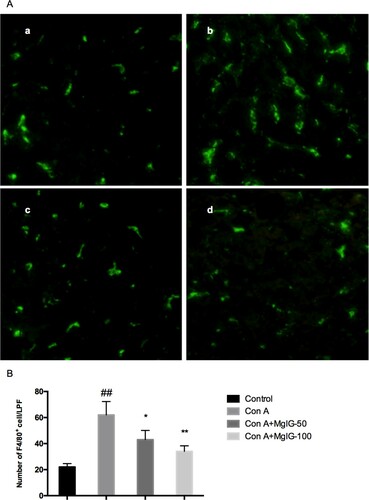
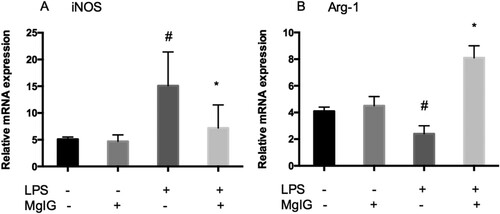
Figure 4. MgIG underpins the regulation of LPS-induced M1 and M2 inflammatory macrophage polarization. (A) iNOS mRNA expression; (B) Arg-1 mRNA expression. The data are expressed as mean ± SD (n = 6, #P < 0.05 versus control alone; *P < 0.05 versus LPS alone).