Figures & data
Figure 1. Effect of PPCE on toxicity and cyclophosphamide-stimulated splenocyte viability. Splenocytes were seeded into a 96-well plate with PPCE (0, 1, 3, 5, 10, 30, 50, 100, 300, 500, or 1000 μg/mL) or PPCE (0, 1, 3, 5, 10, 30, 50, 100, or 300 μg/ml) and cyclophosphamide (1,600 μg/ml) for 24 h in a 5% CO2 incubator and their viability rates were measured. Bars labeled with different superscripts indicate significant differences (P < 0.05 versus control). Data are presented as means ± standard errors (n = 3).
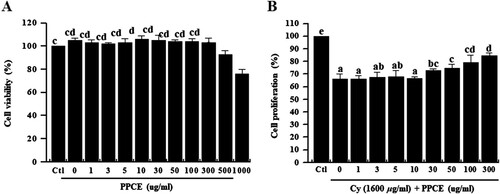
Figure 2. Effect of PPCE on cytokine levels in splenocytes. Cells were seeded into 96-well plates, followed by treatment with PPCE (0, 5, 10, 30, 50, 100, 300 μg/ml) and cyclophosphamide (Cy; 1,600 μg/ml) and incubated for 24 h in a 5% CO2 incubator. Levels of TNF-α, IFN-γ, IL-2, and IL-12 secretion into the culture medium were analyzed using ELISA kits. Bars labeled with different superscripts have significantly different values (P < 0.05 vs. control). Data are presented as means ± standard errors (n = 3).
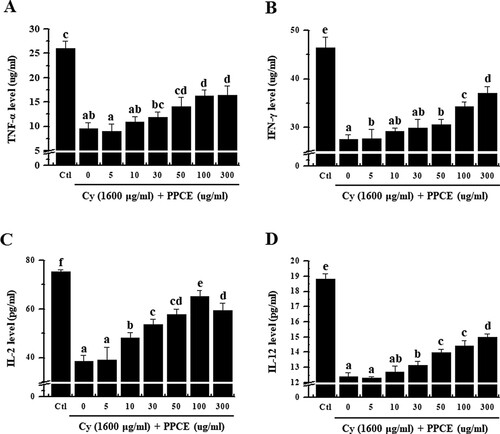
Figure 3. Effect of PPCE on NK cell activity. Splenocytes were co-cultured with target cells (YAC-1) in 96-well plates, followed by treatment with PPCE (0, 5, 10, 30, 50, 100, and 300 μg/ml) and incubated for 24 h in a 5% CO2 incubator with a ratio of effector to target cells of 20:1. The NK cell activity was calculated as the survival rate of YAC-1 compared to that of the control group. Bars labeled with different superscripts have significantly different values (P < 0.05 vs. control). Data are presented as means ± standard errors (n = 3).
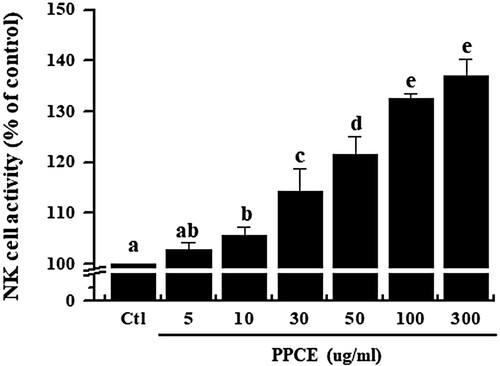
Figure 4. The effect of PPCE on the swimming time. The test was carried out an hour after the treatment with PPCE on day 28, the final day of treatment. The animal experiment was performed in six groups [the normal group, Normal (saline) and Control (saline), GE (100 mg/kg, positive control), PPCE (30, 100, or 300 mg/kg) + Cy (10 mg/kg) ]. When the animal stopped moving, they were placed in the device and were assessed for up to 10 s. Bars labeled with different superscripts indicate significant differences values (P < 0.05 versus control). Data are presented as means ± standard errors (n = 7).
![Figure 4. The effect of PPCE on the swimming time. The test was carried out an hour after the treatment with PPCE on day 28, the final day of treatment. The animal experiment was performed in six groups [the normal group, Normal (saline) and Control (saline), GE (100 mg/kg, positive control), PPCE (30, 100, or 300 mg/kg) + Cy (10 mg/kg) ]. When the animal stopped moving, they were placed in the device and were assessed for up to 10 s. Bars labeled with different superscripts indicate significant differences values (P < 0.05 versus control). Data are presented as means ± standard errors (n = 7).](/cms/asset/1710c1f3-0660-4fa1-9c7e-d1e1e588754c/cfai_a_1540552_f0004_ob.jpg)
Figure 5. Effects of PPCE on the absolute number of leukocytes, neutrophils, lymphocytes, monocytes, eosinophils, and basophils in whole blood of rats. Seven male rats per group were orally administered saline, cyclophosphamide (Cy; 10 mg/kg), GE (100 mg/kg, positive control) + Cy (10 mg/kg), and PPCE (30, 100, or 300 mg/kg) + Cy (10 mg/kg) once daily for 28 days. Whole blood was collected from the abdominal vena cava in ethylenediaminetetraacetic acid (EDTA) microtubes and leukocytes, neutrophils, lymphocytes, monocytes, eosinophils, and basophils were enumerated with Hemavet950 (Drew Scientific Group, Dallas, TX, USA). Bars labeled with different superscripts indicate significant differences values (P < 0.05 versus control). Data are presented as means ± standard errors (n = 7).
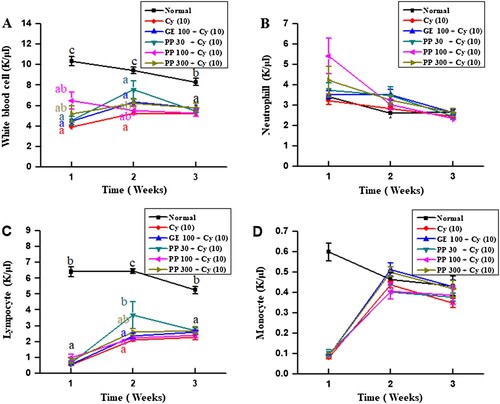
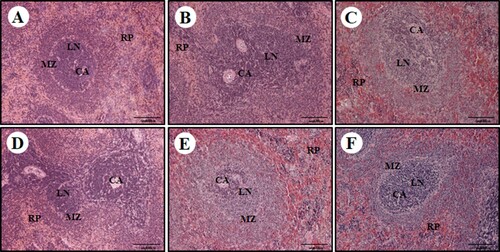
Figure 6. Effect of PPCE on cyclophosphamide (Cy)-associated spleen damage in Sprague Dawley (SD) rats. SD rats were oral administrated with the normal (saline), Cy (10 mg/kg), GE (100 mg/kg, positive control) + Cy (10 mg/kg), and PPCE (30, 100, or 300 mg/kg) + Cy (10 mg/kg) after which spleen damage was analyzed histologically. Representative images of the sectioned spleens of (a) normal rats (saline treatment), (b) control rats (treated with only Cy), (c) PPCE 30 mg/kg + Cy, (d) PPCE 100 mg/kg + Cy), (e) PPCE 300 mg/kg + cy), and (F) positive control (GE 100 mg/kg and Cy). Scale bar = 200 μm. CV, central vein; LN, lymph nodule; MZ, marginal zone; RP, red pulp.