
Figures & data
Figure 1. IL-18 content 1 week after sensitization. Mice were orally administered fresh olive oil (POV = 0.92 ± 0.21 mEq/kg) and oxidized olive oil (POV = 50.5 ± 1.51 mEq/kg) 7 days from OXA-sensitization. Fresh olive oil (
 ). The values are mean ± SD (n = 5). **p < .01 vs. the fresh olive oil group.
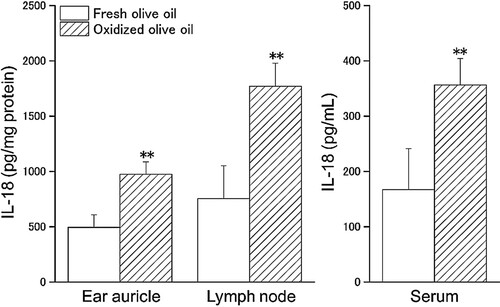
Figure 2. AP-1 and Caspase-1 activity in splenocytes. AP-1 activity was calculated as p-c-Jun/total c-Jun. Fresh olive oil (
). The values are mean ± SD (n = 5). *p < .05 vs. the fresh olive oil group.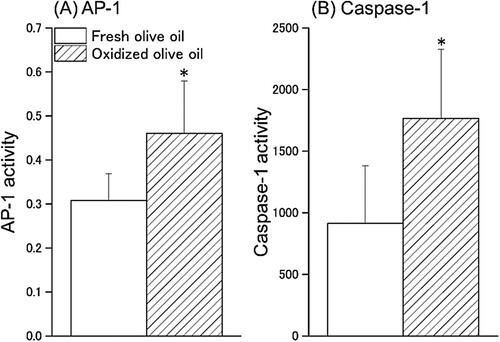
Figure 3. CD3+CD4+ and CD3+CD8+ cell subpopulation. Mice were orally administered fresh olive oil (POV = 1.52 ± 1.31 mEq/kg) and oxidized olive oil (POV = 51.8 ± 0.09 mEq/kg) 7 days from OXA-sensitization. Seven days after sensitization, splenocytes were analyzed by flow cytometry. Shown are representative dot plots of CD3 vs. CD4 and CD8 staining.
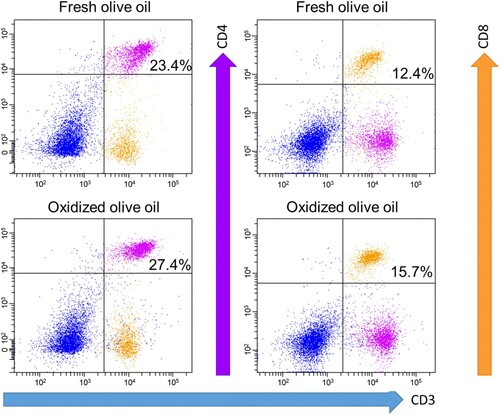
Table 1. T cell subpopulation rate.
Figure 4. mRNA expression in CD3+CD4+ cells. CD3+CD4+ cells were sorted from splenocytes by FACS. POV of fresh and oxidized olive oil were 6.04 ± 1.01 and 48.8 ± 0.54 mEq/kg. The mRNA expression levels of target genes were normalized by Rps18. The relative expression levels of the fresh olive oil group were designated as 100%. Fresh olive oil (
). The values are mean ± SD (n = 4). *p < .05, **p < .01 vs. the fresh olive oil group.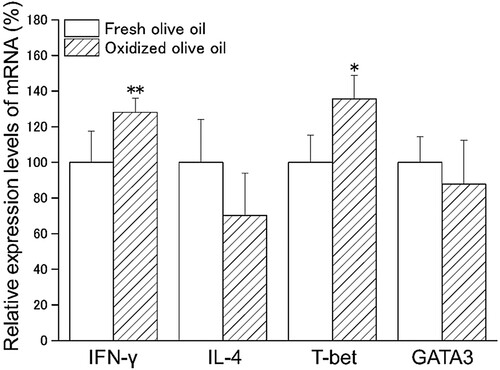
Figure 5. IL-4 production by splenocytes and sorted T cells. IL-4 in culture supernatant 24 h after stimulation was measured by ELISA. (A) Monoculture of splenocytes. (B) Co-culture of splenocytes with APC. (C) Co-culture of CD3+CD4+ cells with APC. (D) Co-culture of CD3+CD8+ cells with APC. POV of fresh and oxidized olive oil were 7.20 ± 2.18 and 53.1 ± 1.07 mEq/kg. Fresh olive oil (
). The values are mean ± SD (n = 5).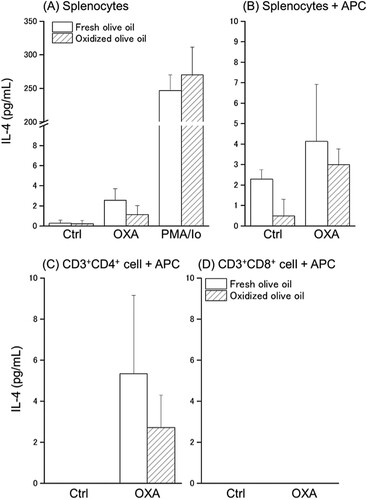
Figure 6. IFN-γ production by splenocytes and sorted T cells. IFN-γ in culture supernatant 24 h after stimulation was measured by ELISA. (A) Monoculture of splenocytes. (B) Co-culture of splenocytes with APC. (C) Co-culture of CD3+CD4+ cells with APC. (D) Co-culture of CD3+CD8+ cells with APC. POV of fresh and oxidized olive oil were 7.20 ± 2.18 and 53.1 ± 1.07 mEq/kg. Fresh olive oil (
). The values are mean ± SD (n = 5). *p < .05, **p < .01 vs. the fresh olive oil group.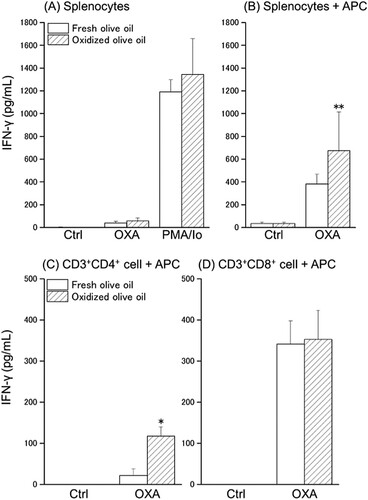
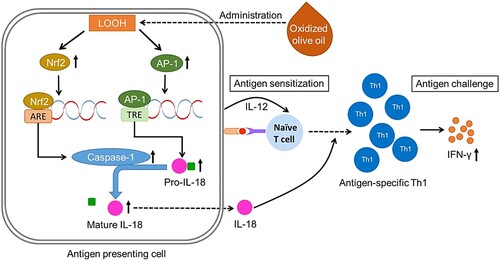
Figure 7. Schematic of the proposed mechanism of CHS exacerbation by oxidized olive oil-administration. Hydroperoxide contained in the administered oxidized olive oil increases the activity of caspase-1 via Nrf2 and increases pro-IL-18 production via AP-1 followed by an increase of mature IL-18. Secreted IL-18 promotes the differentiation of naïve T cells to Th1 by stimulation of APC. CHS is exacerbated by promoting antigen-specific IFN-γ production by increased antigen-specific Th1 cells.
Data availability statement
The data that support the findings of this study are available from the corresponding author, Ogino, H., upon reasonable request.