Figures & data
Table 1. Basic characteristics of the study groups (mean ± standard deviation).
Table 2. Changes in 2000-m rowing ergometer performance prior to and after supplementation.
Figure 1. Changes in IL-2 (A), IL-4 (B), IL-10 (C) and IFN-gamma (D) levels during exercise tests performed prior to and after the supplementation (mean ± SD).
Note. IL: interleukins; INF γ: interferon gamma; • SUPPL: supplemented group; □ – PLA: placebo group; B: baseline; Ex: post-exercise; R: after a 1-day recovery; †: significantly different compared to the baseline level; #: significantly different compared to the post-exercise level.
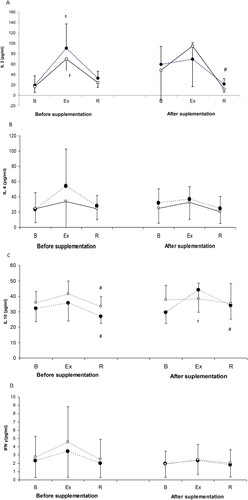
Figure 2. IL-2/IL-4 (A), IL-2/IL-10 (B), IFN-gamma/IL-4 (C) and IFN-gamma/IL-10 (D) ratios during exercise tests performed before and after the supplementation (mean ± SD).
Note. IL: interleukins; INF γ: interferon gamma; • SUPPL: supplemented group; □ – PLA: placebo group; B: baseline; Ex: post-exercise; R: after a 1-day recovery; †: significantly different compared to the baseline level; #: significantly different compared to the post-exercise level.
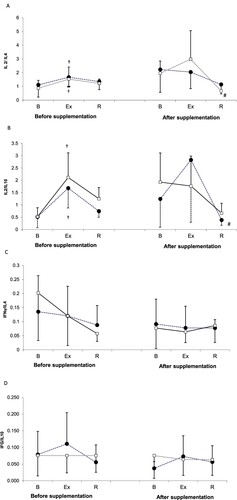
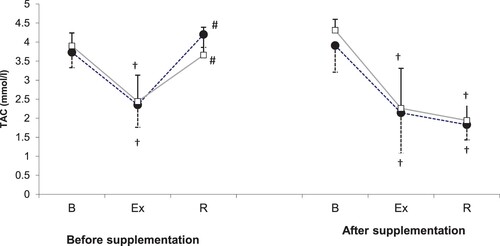
Figure 3. TAC levels during exercise tests performed prior to and after the supplementation (mean ± SD).
Note. TAC: total antioxidants status; • – SUPPL: supplemented group; □: PLA = placebo group; B = baseline; Ex = post-exercise; R = after a 1-day recovery; † – significantly different compared to the baseline level; # - significantly different compared to the post-exercise level.