Figures & data
Scheme 1. (A) Schematic illustration of the QDs-mAb probes preparation. (B) Schematic illustration of the established competitive fluorescence immunoassay for pesticide detection.
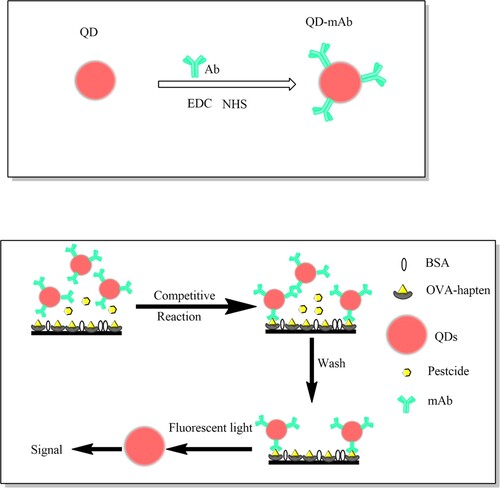
Figure 1. Characterisation of a series amount of molar ratio between mAb and QDs.
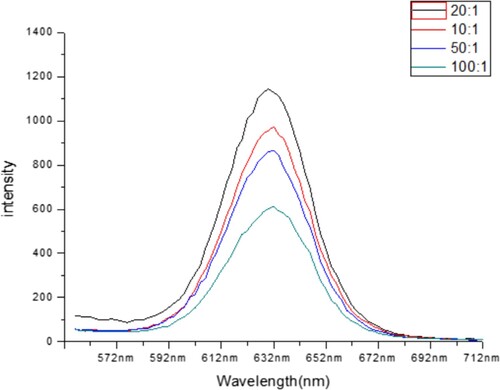
Figure 2. Characterisation of QDs-mAb probes. (A) TEM micrographs of QDs, (B) TEM micrographs of QDs-mAb. Normalised fluorescent spectra (C) of QDs (upper line) and QDs-mAb (lower line). The UV–Vis spectrum (D) of bare mAb (upper line), QDs modified with antibodies (middle line), and bare QDs (lower line).
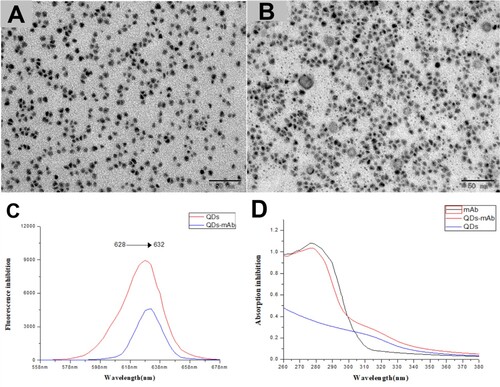
Table 1. Optimized working concentrations of QDs-mAb and OVA-hapten.
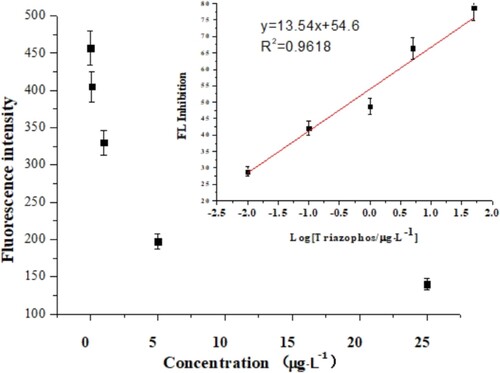
Figure 3. The standard curve of triazophos; the linear range was 0.01–25 μg L−1; three replicates were performed.