Figures & data
Figure 1 (A): The absorption spectra curves of KLH and BSA carrier proteins, Van-KLH and Van-BSA conjugates and Van from an ultraviolet full wavelength scanner. The Van, KLH and Van-KLH conjugates were belongs to proteins and they had a characteristic maximum absorption wavelength at 280 nm, and the Van-KLH conjugates had an obvious offset in the characteristic maximum absorption wavelength that compared with Van and KLH at the same concentration (A1). The BSA and Van-BSA were also belongs to proteins and they had a characteristic maximum absorption wavelength at 280 nm, and the Van-BSA conjugates had an obvious offset in the characteristic maximum absorption wavelength that compared with Van and BSA at the same concentration too (A2). (B): The ELISA values of prepared Van-KLH (B1) and Van-BSA (B2) conjugates analyzed by anti-Van monoclonal antibody (Van-BTG immunogen), and the OD450 values were the means ± SDs from triplicate measurements.
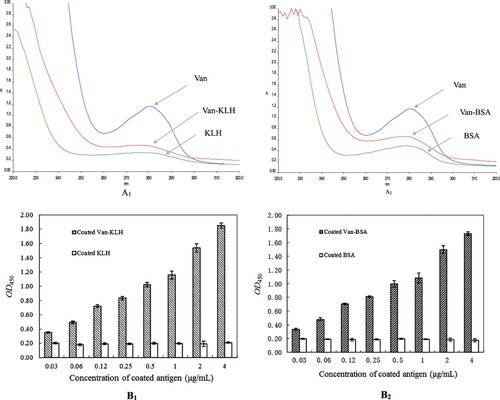
Figure 2 (A): The four rounds of immune efficacy analyzation of Van-KLH conjugate to rabbit by serum-based ELISA for Van, the coated antigen were Van-BSA and the negative control were coated equivalent BSA. The presented OD450 values were the means ± SDs from triplicate measurements. (B): The purify efficacy analyzation of anti-Van pAbs proteins from the booster immunized rabbit serum by SDS-PAGE, and the anti-Van pAbs proteins were successively purified by using saturated ammonium sulfate precipitation and HiTrap protein A HP columns. M: Protein marker; Lanes 1 and 2: The purified anti-Van pAbs proteins from HiTrap protein A HP columns were treated with β-mercaptoethanol denaturing buffer, and the two of heavy chain (approximately 50 kDa) and the two of light chain (approximately 25 kDa) were released, respectively. Lane 3: The purified anti-Van pAbs proteins (approximately 150 kDa) from HiTrap protein A HP columns were treated with non-denaturing buffer. Lanes 4 and 5: The primary purified anti-Van pAbs proteins from the booster immunized rabbit serum by using saturated ammonium sulfate precipitation; Lane 6: The primordial booster immunized rabbit serum.
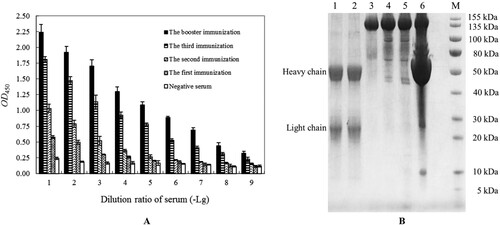
Figure 3. The optimal working concentration analyzation of the prepared Eu3+-labelled goat anti-rabbit IgG monoclonal antibody for the purified anti-Van rabbit pAbs by using an indirect non-competitive TRFIA. The presented P/N values were the means ± SDs from triplicate measurements. “P”: coated anti-Van rabbit pAbs in TRFIA assay buffer. “N”: added equal volume of TRFIA assay buffer.
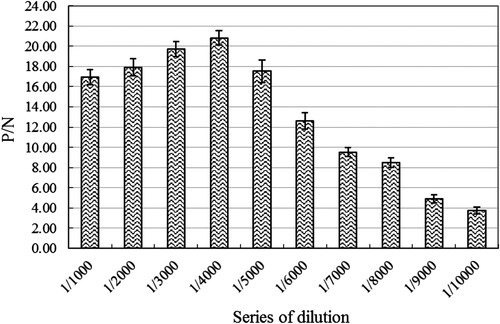
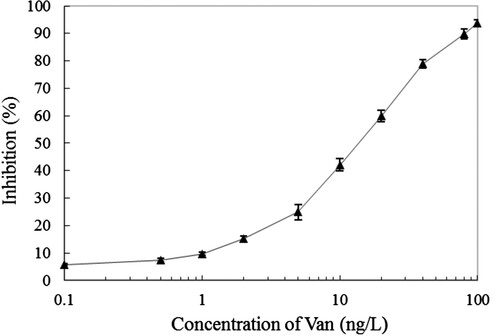
Figure 4. The standard curve of established IC-TRFIA for Van based on the purified anti-Van pAbs and Eu3+-labelled goat anti-rabbit IgG monoclonal antibody. The presented inhibition ratio values were the means ± SDs from triplicate measurements.