Figures & data
Figure 1. Hapten synthesis of PZQ-HS.
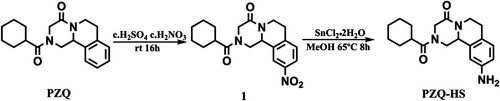
Figure 2. LC–MS analysis of PZQ derivatives.
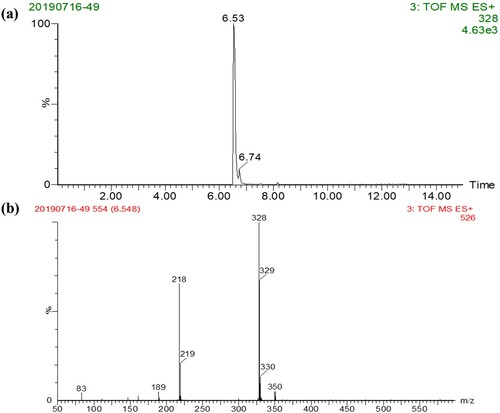
Figure 3. The indirect competitive inhibition non-linear standard curve for praziquantel of 4E9. (a) the variable of methanol content in PBS, (b) the variable of pH in PBS, (c) the variable of ionic strength in PBS, and (d) standard inhibition curve for the ic-ELISA.
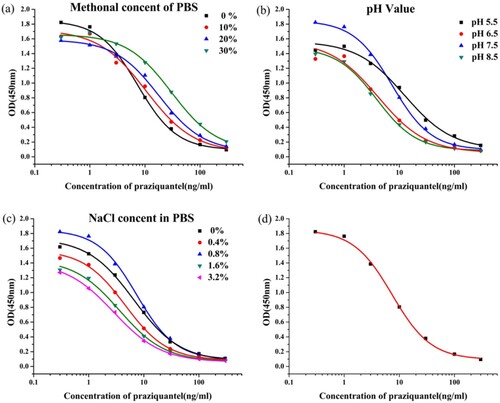
Table 1. Recovery of PZQ in mackerel by ic-ELISA and strip assay.
Figure 4. Optimisation of different antibodies and coating antigens. Antibody 4E9 and coating 1 were better. 1 = 0 ng/mL, 2 = 50 ng/mL.
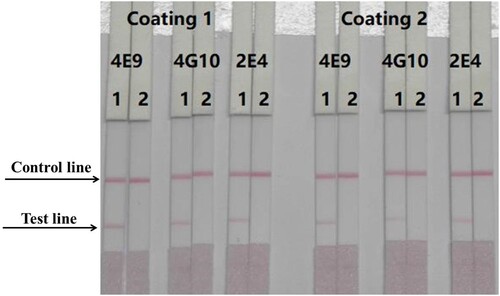
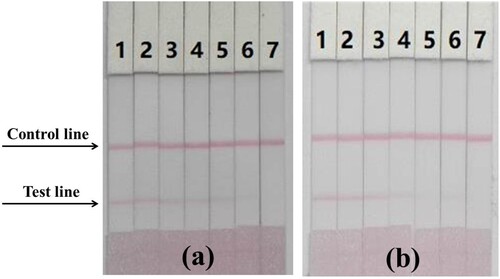
Figure 5. Immunochromatography strips. (a) Images of the detection of PZQ in PBS. 1 = 0 ng/mL, 2 = 0.5 ng/mL, 3 = 1 ng/mL, 4 = 2.5 ng/mL, 5 = 5 ng/mL, 6 = 10 ng/mL, 7 = 25 ng/mL. (b) Images of the detection of PZQ in mackerel. 1 = 0 ng/mL, 2 = 1 ng/mL, 3 = 2.5 ng/mL, 4 = 5 ng/mL, 5 = 10 ng/mL, 6 = 25 ng/mL, 7 = 50 ng/mL.