Figures & data
Figure 1. Chemical formulas of PC and EA.
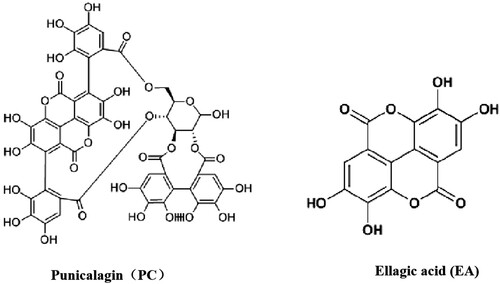
Figure 2. HPLC analysis of pomegranate peel polyphenols extracts. The tR/content of PC and EA were in bold marks.
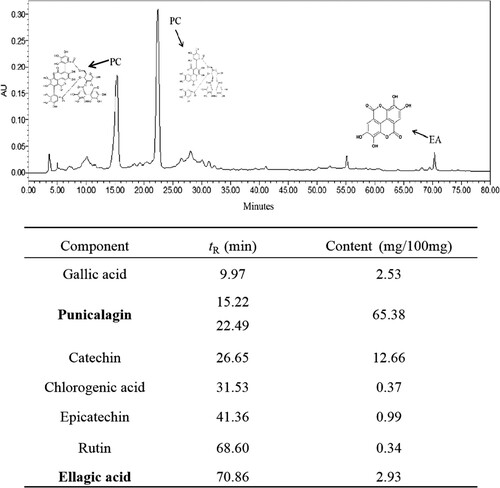
Figure 3. Effects of PC and EA on antiproliferation of HepG2 cells (A) and L0-2 cells (B). *p < 0.05, **p < 0.01.
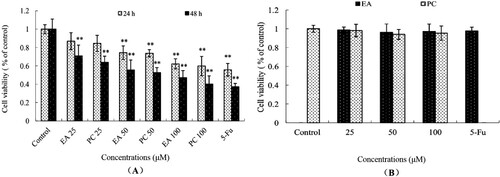
Figure 4. Effects of PC and EA on morphology of HepG2 cells. Magnification, 400×.
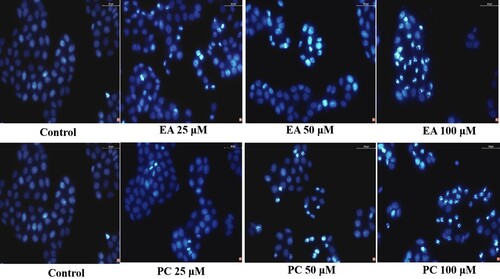
Figure 5. Effects of PC and EA on cell cycle arrest in HepG2 cells. (A) Representative histograms of DNA content in the cells incubated with different concentrations of PC or EA (0, 50 and 100 μM) for 48 h, 5-Fu was set as positive control group; (B) Percentage of cell populations in G0/G1, S and G2/M phases. *p < 0.05, **p < 0.01.
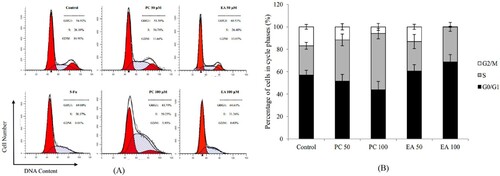
Figure 6. Effects of PC and EA on apoptosis induction. (A) Cells were treated with different concentration of PC and EA at 0(control), 50 and 100 μM for 48 h, 5-Fu was set as positive control group; (B) Quantitative analysis of apoptotic cells. **p < 0.01.
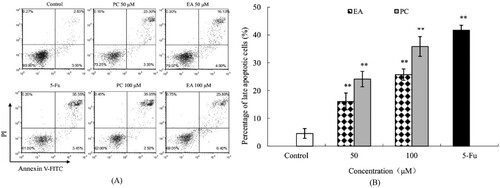
Figure 7. Effects of PC and EA on caspase activities ((A) caspase-3, (B) caspase-9) and ROS production (C) in HepG2 cells. *p < 0.05, **p < 0.01.
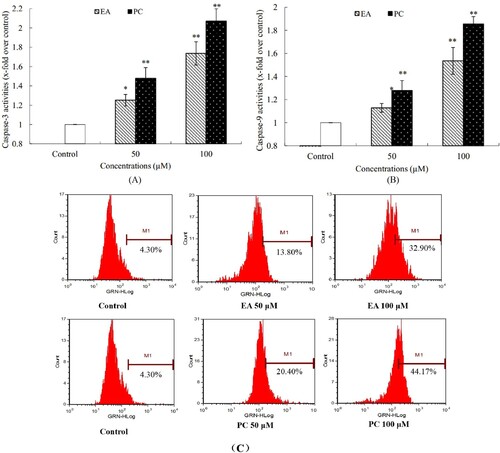
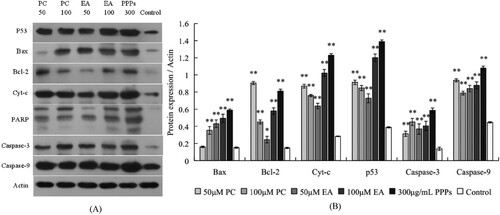
Figure 8. Effects of apoptosis-related proteins in response to PC, EA and PPPs treatment. (A) typical western blot bands for p53, Bax, Bcl-2, Cyt-c and PARP; (B) statistical analysis. *p < 0.05, **p < 0.01.