Figures & data
Table 1. The primer sequences used in the real-time PCR.
Figure 1. Effects of Arg on cell viability. (A) Toxicity of Arg on cell viability; (B) toxicity of LPS on cell viability; (C) time-dependent effects of Arg on cell viability; (D) time-dependent effects of LPS on cell viability; (E) effects of Arg on cell viability of IOECs challenged by LPS. Con, Arg-free DMEM; LPS, Arg-free DMEM supplemented with 10 μg/mL LPS; Arg + LPS, Arg-free DMEM supplemented with both 10 μg/mL LPS and 100 μM L-arginine; Arg, Arg-free DMEM supplemented with 100 μM L-arginine. Values are expressed as means ± SEM, n = 6/group. Mean values in columns without a common letter differ (P < 0.05).
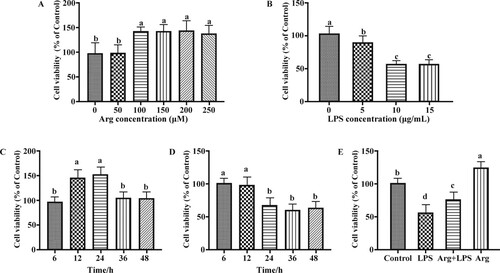
Figure 2. Effects of Arg on intestinal barrier function in LPS-treated IOECs for 24h. TEER (A) and paracellular permeability (B) were determined. TEER, transepithelial electrical resistance; Con, Arg-free DMEM; LPS, Arg-free DMEM supplemented with 10 μg/mL LPS; Arg + LPS, Arg-free DMEM supplemented with both 10 μg/mL LPS and 100 μM L-arginine; Arg, Arg-free DMEM supplemented with 100 μM L-arginine. Values are expressed as means ± SEM, n = 6/group. Mean values in columns without a common letter differ (P < 0.05).
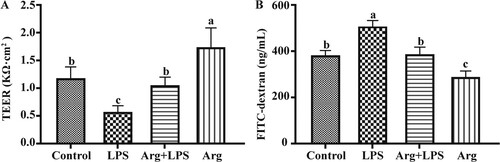
Table 2. Effects of Arg on concentrations of cytokines in LPS-treated IOECs for 24h.
Table 3. Effect of Arg on the content of NO and activity of NOS in LPS-treated IOECs for 24 ha.
Table 4. Effects of Arg on the mRNA abundance of genes in LPS-treated IOECs for 24 h.
Figure 3. The effect of Arg on TLR4 and NF-κB protein expression in LPS-treated IOECs for 24 h. Values are means, with standard errors represented by vertical bars. The protein expression value = densitometry units of selected protein/densitometry units of β-actin detected by western blotting. TLR4, Toll-like receptor 4; NF-κB Nuclear factor-κB; Con, Arg-free DMEM; LPS, Arg-free DMEM supplemented with 10 μg/mL LPS; Arg + LPS, Arg-free DMEM supplemented with both 10 μg/mL LPS and 100 μM L-arginine; Arg, Arg-free DMEM supplemented with 100 μM L-arginine. Values are expressed as means ± SEM, n = 6/group. Mean values in columns without a common letter differ (P < 0.05).
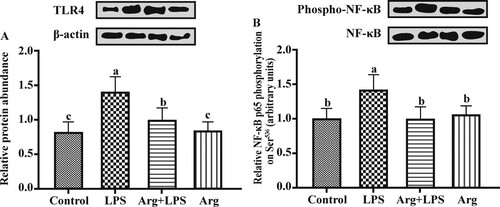
Figure 4. The effect of Arg on the relative protein (A) ZO-1 and (B) claudin-1 expression levels in LPS-treated IOECs for 24 h. Values are means, with standard errors represented by vertical bars. The protein expression value = densitometry units of selected protein/densitometry units of β-actin detected by western blotting. ZO-1, zonula occludens-1; Con, Arg-free DMEM; LPS, Arg-free DMEM supplemented with 10 μg/mL LPS; Arg + LPS, Arg-free DMEM supplemented with both 10 μg/mL LPS and 100 μM L-arginine; Arg, Arg-free DMEM supplemented with 100 μM L-arginine. Values are expressed as means ± SEM, n = 6/group. Mean values in columns without a common letter differ (P < 0.05).
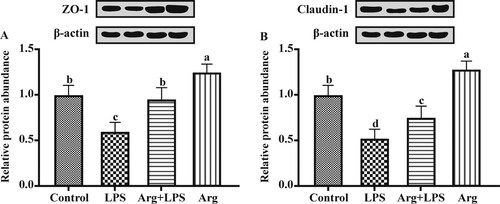
Figure 5. Effects of Arg on the mTOR signalling pathways in LPS-treated IOECs for 24 h. Phosphorylation state of (A) Akt, (B) mammalian target of rapamycin (mTOR) and (C) p70 S6 kinase (S6K1) in LPS-treated IOECs. Akt phosphorylation on Ser473, mTOR phosphorylation on Ser2448 and S6K1 phosphorylation on Thr389 were measured by western blot analysis using antibodies that recognize these proteins only when that residue was phosphorylated. Western blots are shown above each graph. Values for phosphorylation of each protein were normalized for total protein. Values are means, with their standard errors represented by vertical bars. Con, Arg-free DMEM; LPS, Arg-free DMEM supplemented with 10 μg/mL LPS; Arg + LPS, Arg-free DMEM supplemented with both 10 μg/mL LPS and 100 μM L-arginine; Arg, Arg-free DMEM supplemented with 100 μM L-arginine. Values are expressed as means ± SEM, n = 6/group. Mean values in columns without a common letter differ (P < 0.05).
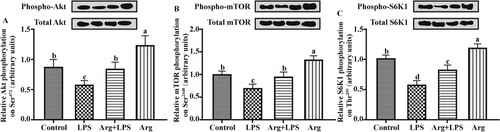
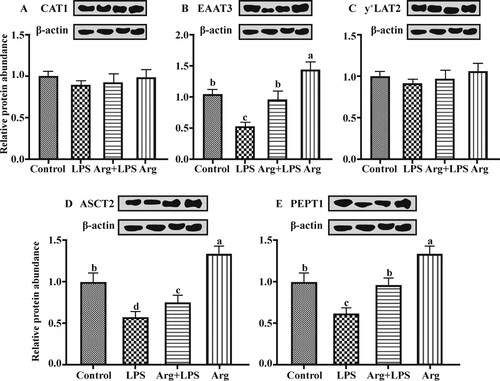
Figure 6. Effects of Arg on the protein abundance of amino acid and peptide transporters in LPS-treated IOECs for 24 h.Values are means, with standard errors represented by vertical bars. The protein expression value = densitometry units of selected protein/densitometry units of β-actin detected by western blotting. (A) CAT1, (B) EAAT3, (C) y+LAT2, (D) ASCT2, and (E) PEPT1 were encoded by SLC7A1, SLC1A1, SLC7A7, SLC1A5, and SLC15A1, respectively. CAT1, cationic amino acid transporter, y+ system, member 1; EAAT3, neuronal/epithelial high-affinity glutamate transporter, system XAG, member 1; y+ LAT2, amino acid transporter light chain, y+ L system, member 7; ASCT2, alanine–serine–cysteine amino acid transporter 2; PEPT1, peptide transporter 1; Con, Arg-free DMEM; LPS, Arg-free DMEM supplemented with 10 μg/mL LPS; Arg + LPS, Arg-free DMEM supplemented with both 10 μg/mL LPS and 100 μM L-arginine; Arg, Arg-free DMEM supplemented with 100 μM L-arginine. Values are expressed as means ± SEM, n = 6/group. Mean values in columns without a common letter differ (P < 0.05).