Figures & data
Figure 1. Schematic of the AIEFM-LFIA on the basis of competitive format immunoassay principle to analyse SMZ.
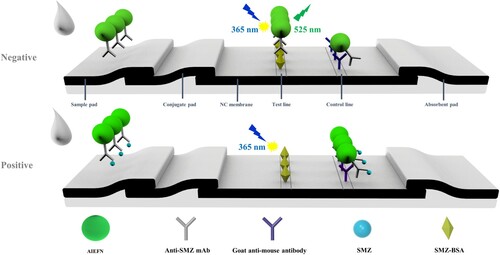
Figure 2. Characterization of AIEFM and AIEFM-mAb. Hydration size of AIEFM and AIEFM-mAb (A). Fluorescence spectrum of AIEFM (B). Digital photos of AIEFM under natural light (C). Digital photos of AIEFM under UV light (D).
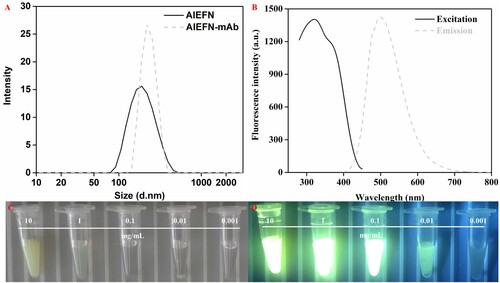
Figure 3. Optimization of the key factors of the AIEFM-LFIA test strips. Optimization of the coupling pH (A), usage volume of the EDC (B), amount of mAb to prepare the AIEFM-mAb label (C), concentration of SMZ-BSA on the T line (D), amount of the AIEFM-mAb label (E), and immunological kinetic analysis of the AIEFM-LFIA (F).
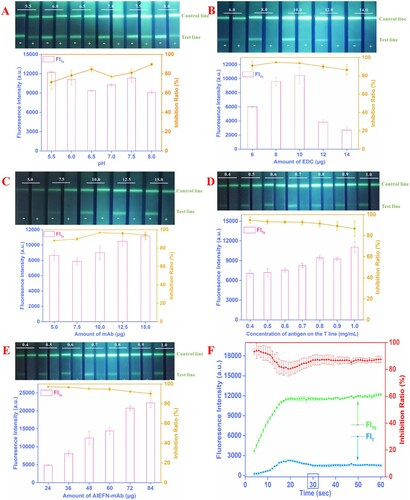
Table 1. Sensitivity and linear range of the AIEFM-LFIA in PBS and honey.
Figure 4. Specificity of AIEFM-LFIA. The specificity of the proposed AIEFM-LFIA was assessed by testing 11 SAs and three non-SA antibiotic drugs (ENR, FLO, and TET).
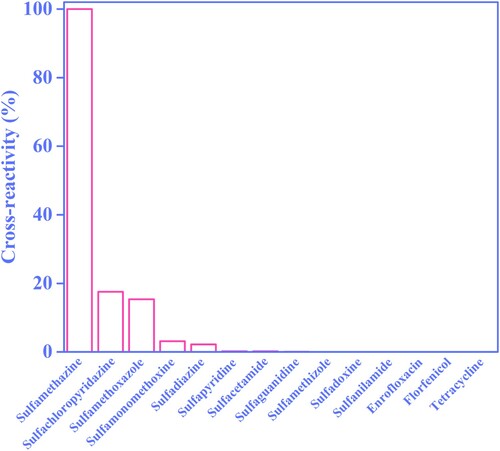
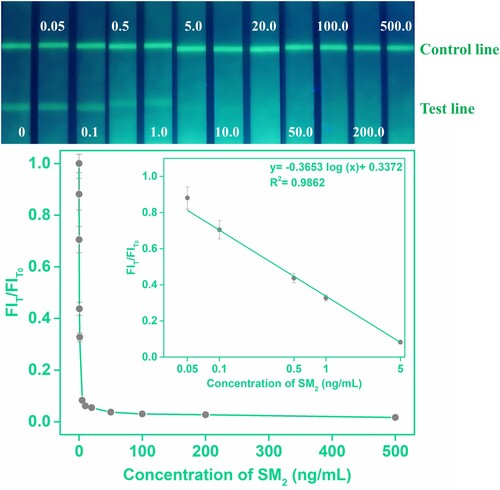
Figure 5. Standard calibration curves of the AIEFM-LFIA in honey were obtained by determining the FIT/FIT0 against the logarithm of the concentration of the SMZ.