Figures & data
Figure 1. Conjugation of cadium ions with carrier protein.
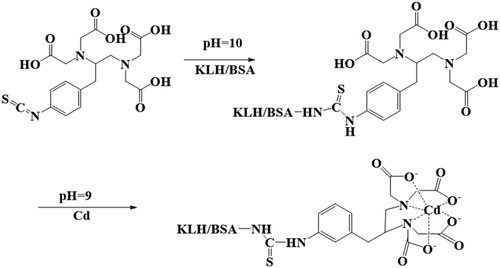
Figure 2. The ultraviolet-visible absorption spectra of artificial antigen. (a) Cadmium-ITCBE-KLH; (b) Cadmium-ITCBE-BSA.
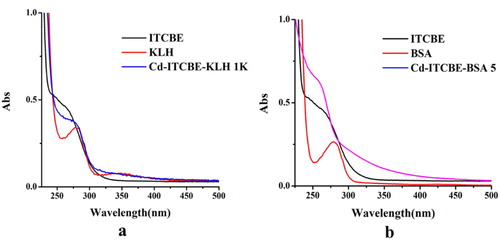
Figure 3. The characterization of antigen and antibody. (a) Polyacrylamide gel electrophoresis images of artificial antigen. 1: BSA; 2: Cd-ITCBE-BSA; (b) Standard curve obtained by indirect competitive ELISA based on antibody 2F7.
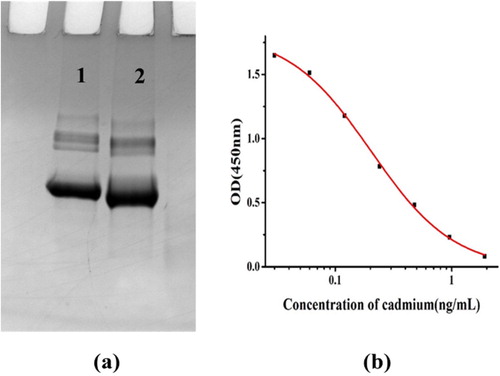
Table 1. Cross-reaction results of mAb 2F7.
Figure 4. The optimization of the fluorescent immunochromatographic strip. (a) Optimize six kinds of resuspends: 1 = PVP, 2 = PEG, 3 = BSA, 4 = Tween-20, 5 = Brij-30, ad 6 = ON-870 and optimize by using two kinds of buffer (a = PBS and b = PBS + 3% ON870); (b) Optimize the coating concentration (0.05 or 0.1 mg/mL). C = 0.2 mg/mL. 0.7 uL. TM pad. Dilute 1:5 using resus 3. 1 = 0 ng/mL and 2 = 1000 ng/mL. using 10 µM ITCBE.
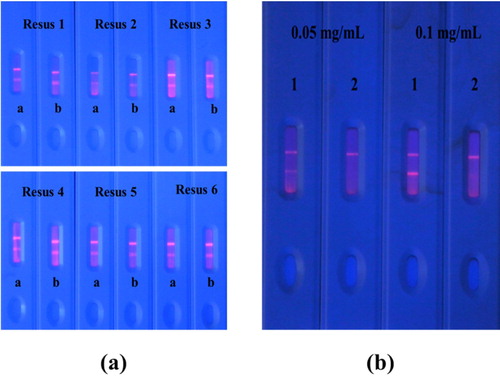
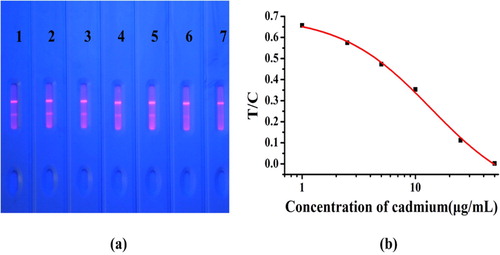
Figure 5. Performance of the test strip. (a) Typical photo image of cadmium detection by fluorescent test strip in rice samples. 1 = 0 µg/kg, 2 = 1 µg/kg, 3 = 2.5 µg/kg, 4 = 5 µg/kg, 5 = 10 µg/kg, 6 = 25 µg/kg, and 7 = 50 µg/kg; The cut-off value for cadmium was 50 µg/kg in rice sample. (b) Calibration curve obtained by a strip reader. The X-axis is shown as the concentrations of cadmium; and the Y-axis is shown as the T/C value.