Figures & data
Figure 1. Purification of TAPS and OSPS and determination of their purity and activity. (A) Crude polysaccharides of T. aestivum and O. sativa were isolated by using a DEAE-52 cellulose column eluted with different concentrations of NaCl. (B) UV spectra of TAPS and OSPS. (C) The expression of CD86 on DCs induced by TAPS-W, TAPS, OSPS-W and OSPS. Bone marrow-derived DCs were treated with 20 μg/mL of TAPS-W, TAPS, OSPS-W and OSPS. After 12 h, the expression of CD86 on DCs was detected by flow cytometry. Data are from 3 independent experiments and analysed by ANOVA. ** p < 0.01; *** p < 0.001 compared to untreated DCs.
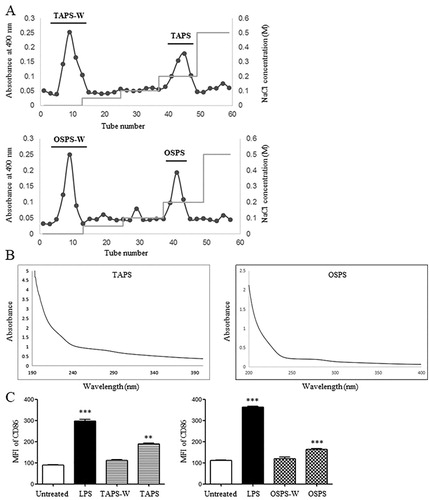
Figure 2. Scanning electron micrographs of TAPS (left) and OSPS (right) with different magnifications including 1000×, 3000× and 5000×.
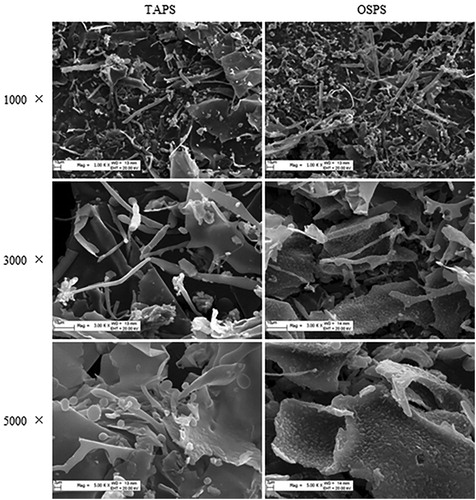
Figure 3. (A) FT-IR spectra of TAPS and OSPS in the range of 4000–400 cm−1. (B) 1H-NMR spectra of TAPS and OSPS.
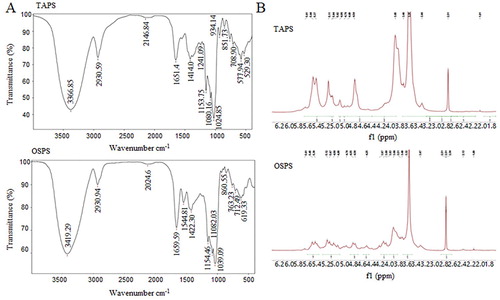
Figure 4. TAPS-C and OSPS-C promoted DC maturation. DCs were treated with different concentrations (10, 20 and 50 μg/mL) of TAPS and OSPS for 12 h. After treatment, the expression of CD40 and CD80 on DCs was detected by flow cytometry (upper panels). The mean fluorescence intensity (MFI) (mean ± SEM) of CD40 and CD80 were shown in lower panels. Data are from 3 independent experiments and analysed by ANOVA. * p < 0.05; ** p < 0.01; *** p < 0.001 compared to untreated DCs.
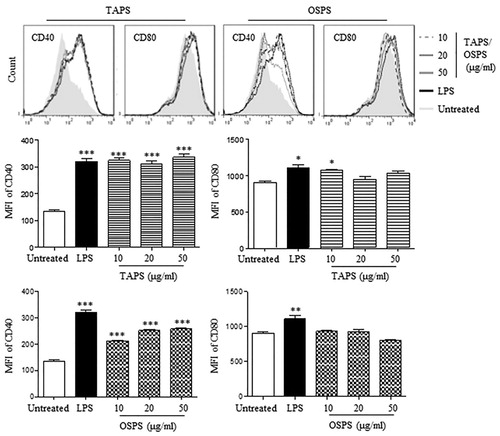
Figure 5. The activities of GUPS, PFPS, TAPS and OSPS on DC maturation and cytokine production. (A) DCs were treated with 20 μg/mL of GUPS, PFPS, TAPS and OSPS. After 12 h, the expression of MHC-I, CD40, CD80 and CD86 on DCs was detected by flow cytometry. (B) The supernatants were collected and the secretion of IL-12p40 and TNF-α was measured by ELISA. (C) DCs treated with polysaccharides were incubated with 50 μg/mL FITC-dextran at 37°C for 1 h. After staining with anti-CD11c-PE, samples were analysed by flow cytometry. Data are from 3 independent experiments and analysed by ANOVA. * p < 0.05; ** p < 0.01; *** p < 0.001 compared to untreated DCs.
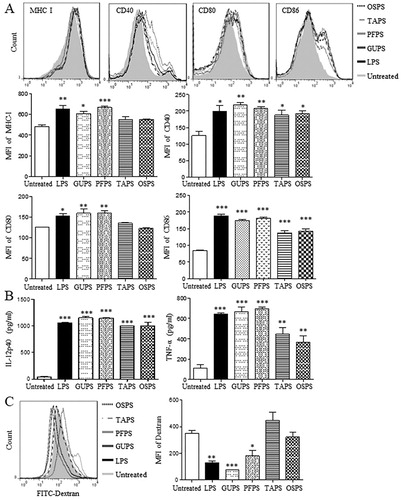
Figure 6. GUPS, PFPS, TAPS and OAPS promoted DC maturation through TLR4. DCs were pretreated with or without TAK-242, and then treated with 20 μg/mL of GUPS, PFPS, TAPS and OSPS for 12 h. The expression of CD40 and CD86 was detected by flow cytometry. Data are from 3 independent experiments. ** p < 0.01; *** p < 0.001 compared to untreated DCs (ANOVA). ## p < 0.01; ### p < 0.001 compared to TAK-242 pretreated DCs (paired t-test).
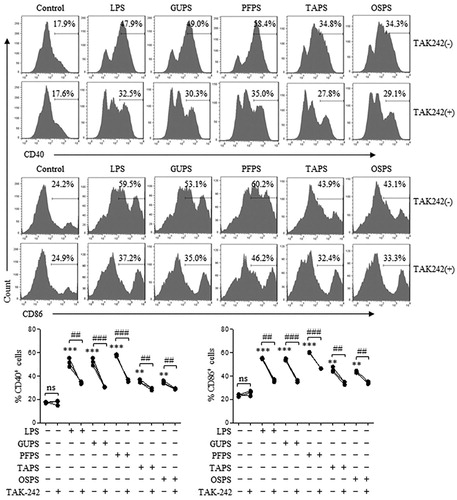
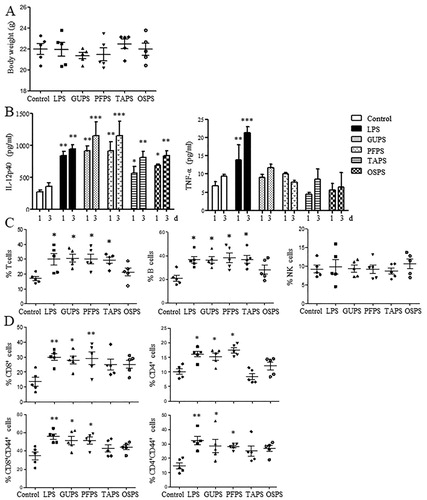
Figure 7. The effects of GUPS, PFPS, TAPS and OSPS on the immunity of mice. Naïve ICR mice were injected with GUPS, PFPS, TAPS, OAPS or LPS intraperitoneally. (A) The levels of IL-12 and TNF-α in sera collected on days 1 and 3. (B) The proportions of T cells, B cells and NK cells in spleen. (C) The proportions of CD4+, CD8+, CD4+CD44+ and CD8+CD44+ T cells in spleen were analysed by flow cytometry. * p < 0.05; ** p < 0.01; *** p < 0.001 compared to control group (ANOVA).