Figures & data
Figure 1. The molecular structure of TMS and TMS-1.
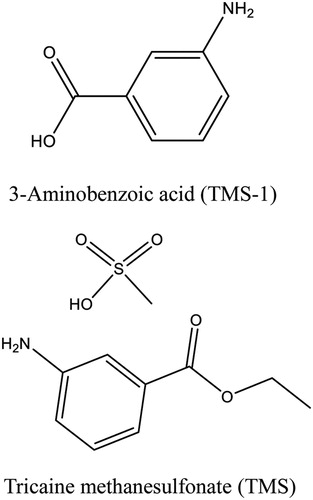
Figure 2. Schematic illustrations of the LF-ICS. (a) The structure of the LF-ICS, (b) The principle of the LF-ICS test for TMS.
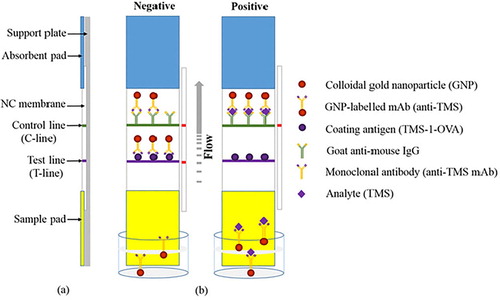
Figure 3. Ultraviolet−visible absorption spectra of immunogen TMS-1-KLH (a) and coating antigen TMS-1-OVA (b).
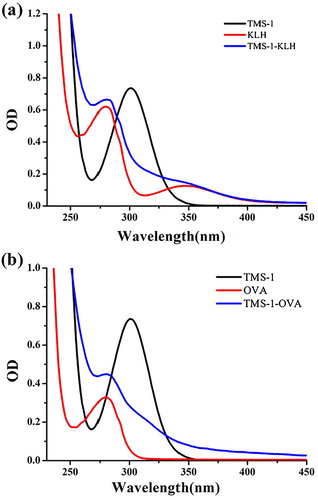
Figure 4. Standard curve for TMS in ic-ELISA test.
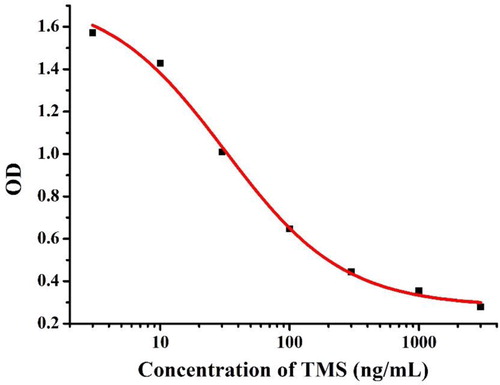
Figure 5. Optimization of the LF-ICS in 0.01 M PBS solution. The concentration of TMS-1-OVA (A) 0.3 mg/mL, (B) 0.8 mg/mL. The volume of K2CO3 (a) 8 μL, (b) 10 μL. The concentration of TMS standards: (1) 0 μg/mL, (2) 2.5 μg/mL.
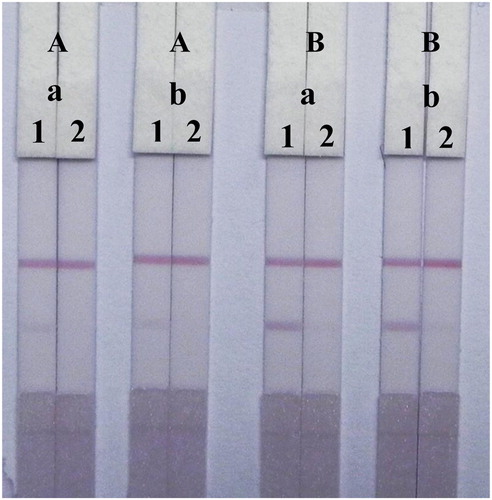
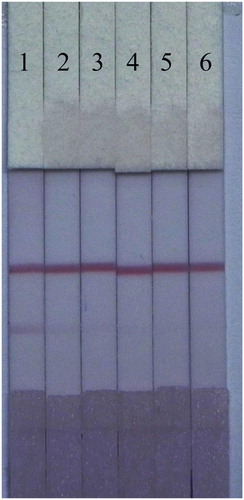
Figure 6. The sensitivity analysis of the LF-ICS in 0.01 M PBS solution. The concentration of TMS standards: (1) 0 μg/mL, (2) 0.1 μg/mL, (3) 0.25 μg/mL, (4) 0.5 μg/mL, (5) 1 μg/mL, (6) 2.5 μg/mL, (7) 5 μg/mL.
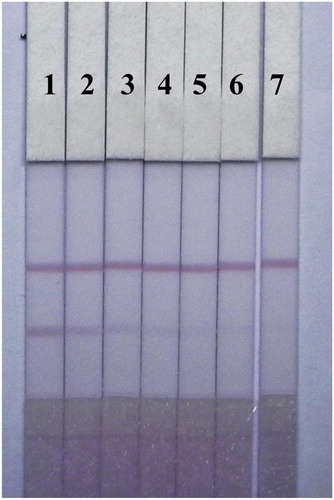
Figure 7. Optimization of 1% surfactants in fish sample. Surfactants: (a) polyethylene glycol, (b) polyvinyl pyrrolidone, (c) BSA, (d) Tween-20, (e) Brij-30, (f) On-870. The concentration of TMS standards: (1) 0 μg/mL, (2) 2.5 μg/mL.
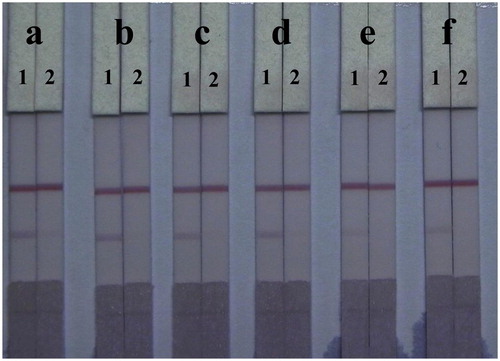
Figure 8. The sensitivity analysis of the LF-ICS in fish samples. The concentration of TMS standards: (1) 0 μg/mL, (2) 0.1 μg/mL, (3) 0.25 μg/mL, (4) 0.5 μg/mL, (5) 1 μg/mL, (6) 2.5 μg/mL.