Figures & data
Figure 1. Chemical structure of rifampicin.
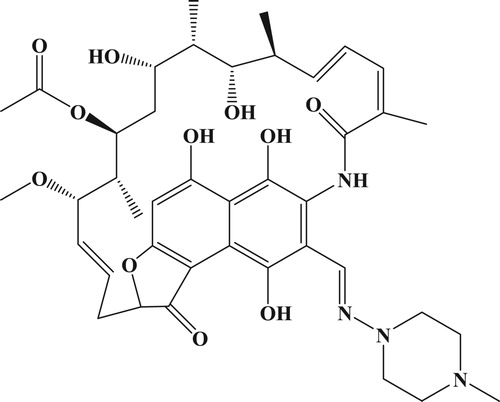
Figure 2. UV spectra characterization for; (a) RFP, KLH, and RFP-CDI-KLH, and (b) RFP, BSA, and RFP-CDI-BSA.
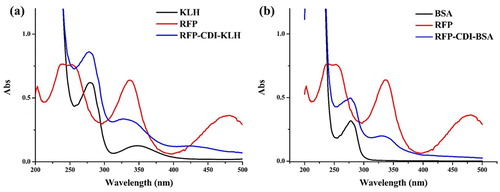
Figure 3. Standard inhibition curve using ic-ELISA for rifampicin.
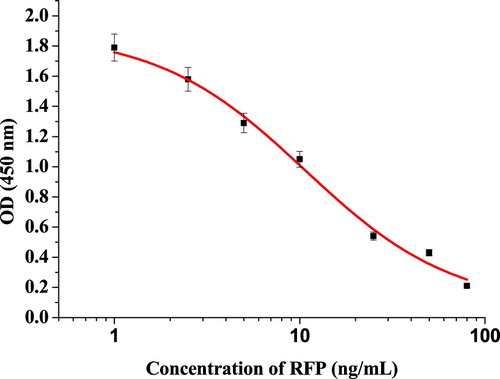
Figure 4. Illustration of typical strip test results.
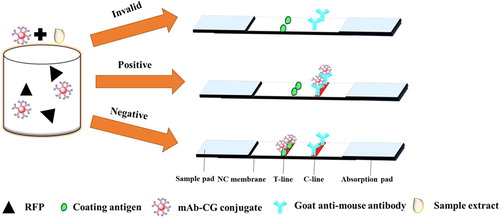
Figure 5. Result of optimization of immunochromatographic strip with 0.01 M PBS (pH 7.4). (a) Optimization using four kinds of surfactants; (A) PVP, (B) PEG, (C) BSA, and (D) Rhodasurf® On-870. (b) The dosage of the mAb that added in GNP; (A) 10 µg/mL, and (B) 8 µg/mL. Standard concentration; (1) 0 µg/mL, and (2) 5 µg/mL.
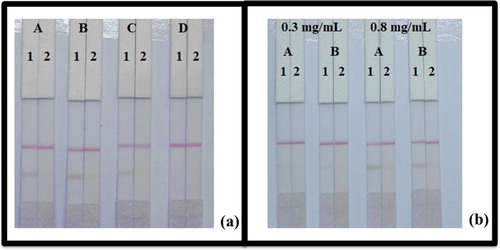
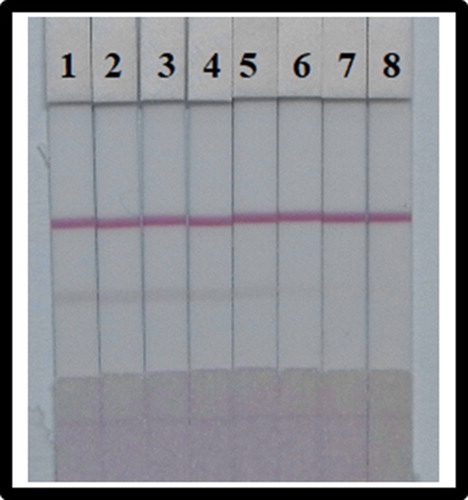
Figure 6. LFIA after optimization (1–8) represents concentrations of 0, 0.1, 0.25, 0.5, 1, 2.5, 5, and 10 µg/mL.
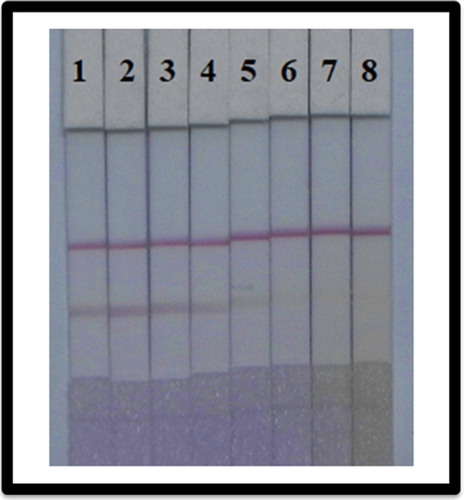
Figure 7. Optimization of LFIA in fish. (a) Result using six kinds of reagents; (A) PVP, (B) PEG, (C) BSA, (D) Brij-35, (E) Triton X-100, and (F) Rhodasurf® On-870. (b) The dosage of the mAb that added in GNP; (A) 10 µg/mL, and (B) 8 µg/mL. Standard concentration; (1) 0 µg/mL, and (2) 5 µg/mL.
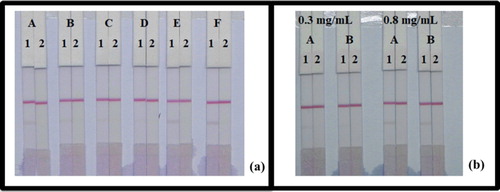
Figure 8. Colloidal gold immunochromatographic assay spiked in fish. After optimization (1–8) represents concentrations of 0, 0.1, 0.25, 0.5, 1, 2.5, 5, and 10 µg/mL.