Figures & data
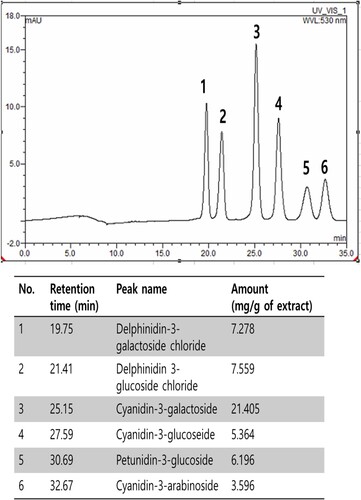
Table 1. Conditions of HPLC analysis for anthocyanins profiling.
Table 2. Total phenolic, total flavonoid, and ascorbic acid contents and the yield of bilberry extract.
Figure 1. The antioxidant of bilberry extract. (a) DPPH radical scavenging, (b) ABTS radical scavenging activity of bilberry extract, (c) nitrite scavenging activity, (d) SOD-like activity, (e) oxidative DNA damage prevention activity of bilberry extract agarose gel electrophoretic patterns of plasmid DNA breaks by hydroxyl radical reaction in the presence of the extract of bilberry. Line 1, plasmid DNA control; Line2, negative plasmid DNA control with FeSO4 and H2O2 (DNA damage control); Line 3–5, plasmid DNA, FeSO4 and H2O2 in the presence of the extract with concentrations of 50, 100 and 200 µg/mL, respectively, (f) reducing power activity of bilberry extract, (g) inhibition of linoleic acid oxidation of bilberry extract. Sample and sodium phosphate buffer (pH 7.0), DW, and 50 mM linoleic acid was mixed and incubated at 40°C for 7 days. Then the above mixture was mixed with 2.5 mL of 75% ethanol, 50 μL of 30% ammonium thiocyanate and 50 μL of 20 mM ferrous chloride and incubation for 3 min at RT. The absorbance was measured at 500 nm wavelength every day. Ascorbic acid was used as a positive control. All data are expressed as mean ± standard deviation (n = 3).
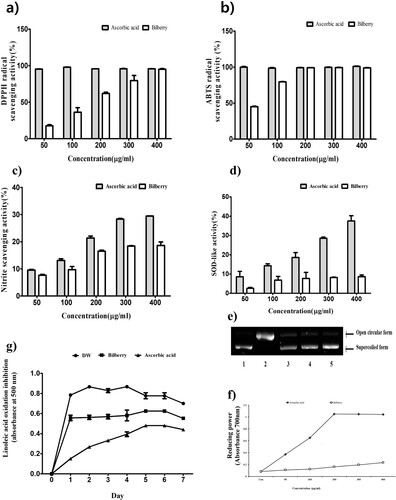
Table 3. DPPH, ABTS and nitrite radical scavenging activity of bilberry extract.
Figure 2 . Effects of bilberry extract on the (a) cell viability in RAW 264.7 and (b) LPS-treated RAW 264.7 cells. After 24 h incubation with the bilberry extracts, cell viability was examined by the MTT assay. (c) Effects of bilberry extract on NO production in LPS-induced Raw 264.7 cells. LPS-induced NO production was measured by Griess assays. All data are expressed as mean ± standard deviation (n = 3). ### P < 0.001 compared with the control group; *P < 0.05, **P < 0.01 and ***P < 0.001 compared with the LPS-treated group.
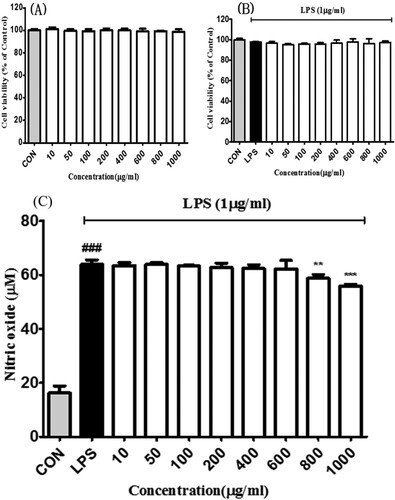
Figure 3. Effects of bilberry extract on COX-2, iNOS, IL-6 and TNF-α protein expressions in LPS-induced RAW 264.7 cells treated with bilberry extract (400 and 800 μg/mL) and 1 µg/ml LPS for 24 h. The COX-2, iNOS, IL-6 and TNF-α proteins were analysed by Western blotting. ###P < 0.001 compared with the control group; *P < 0.05, **P < 0.01, and ***P < 0.001 compared with the LPS-treated group.
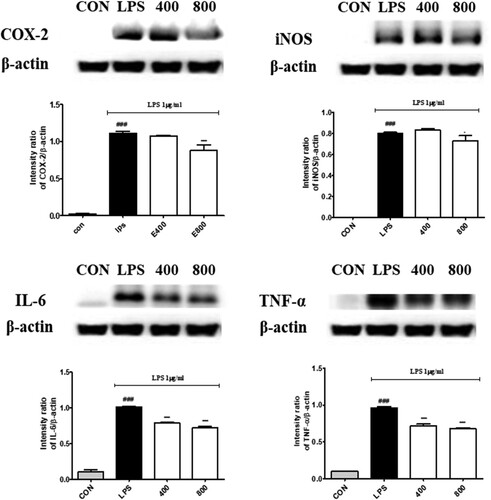
Figure 4. The identification and determination of anthocyanins contents in BE by High-Performance Liquid Chromatography: 1) delphinidin-3-galactoside chloride, (2) delphinidin 3-glucoside chloride, (3) cyanidin-3-galactoside, (4) cyanidin-3-glucoseide, (5) petunidin-3-glucoside and (6) cyanidin-3-arabinoside.