
Figures & data
Table 1. Animal study plan.
Figure 1. Effect of genistein on enzymatic activities and UA levels in mice, (A) SXOD, (B) LXOD, (C) SADA, (D) LADA, (E) SUA, (F) UUA, (G) UA synthesis pathway and effect of genistein on targeted enzyme SXOD: Serum xanthine oxidase, LXOD: liver xanthine oxidase, SADA: Serum adenosine deaminase, LADA: Liver adenosine deaminase, SUA: Serum uric acid, UUA: Urine uric acid,#G1: normal group, G2: Model control group, G3: positive control group, G4: low dose genistein treated group, G5: High dose genistein treated group, *p < .05, **p < .01, ***p < .001 compare with G1, #p < .05, ##p < .01, ###p < .001 compare with G2.
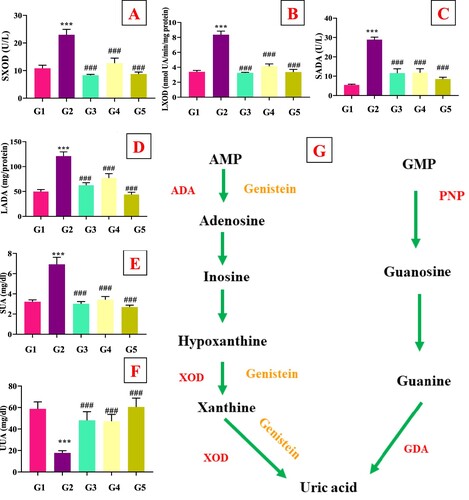
Figure 2. Effect of genistein on renal function tests (A) Serum urea nitrogen, and (B) Serum creatinine,#G1: normal group, G2: Model control group, G3: positive control group, G4: low dose genistein treated group, G5: High dose genistein treated group, *p < .05, **p < .01, ***p < .001 compare with G1, #p < .05, ##p < .01, ###p < .001 compare with G2.
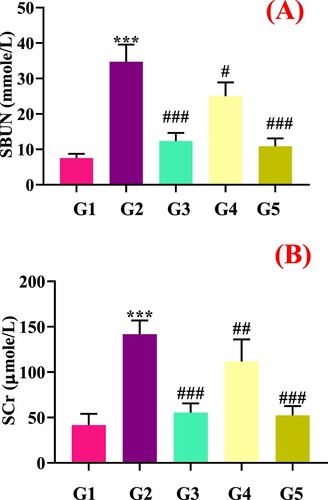
Figure 3. Molecular docking results of genistein and URAT1. (A) Conformation of complexes URAT1-genistein. (B) Profile map of complexes URAT1-genistein. (C) Genistein could bind to the hydrophobic region of URAT1. (D) Vertical view of complexes URAT1-genistein. (E) and (F) represent 3D and 2D interactions between genistein and URAT1, respectively. Open-Source PyMOL and Discovery Studio 2016 Client software were used to create the image.
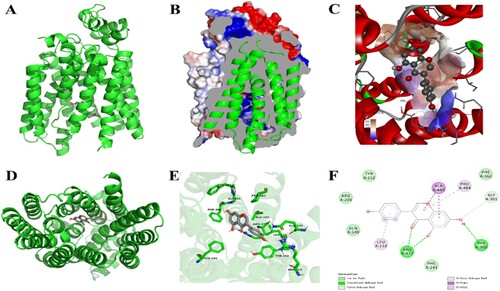
Figure 4. Effect of genistein on renal genes expression of urate transporters and underlying mechanism. (A) URAT1, (B) GLUT9, (C) OCT1, (D) OAT1, (E) OAT3, (F) OCT2, (G) potential mechanism of uric acid lowering via genistein,#G1: normal group, G2: Model control group, G3: positive control group, G4: low dose genistein treated group, G5: High dose genistein treated group, *p < .05, **p < .01, ***p < .001 compare with G1, #p < .05, ##p < .01, ###p < .001 compare with G2.
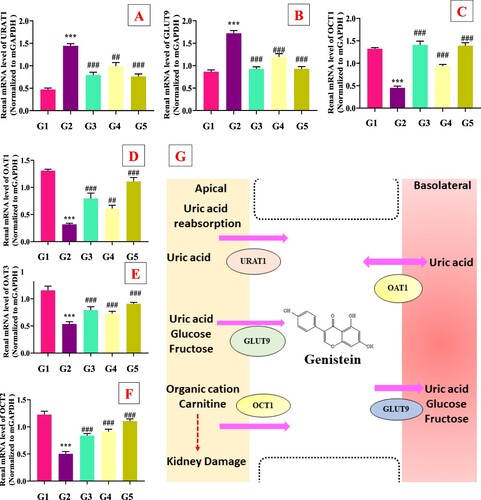
Table 2. Effect of genistein on serum and renal antioxidant activities in PO-induced hyperuricemic mice (n = 10, mean ± SD).
Figure 5. Effect of genistein on renal#histopathology features (magnification at 300×). G1: normal group, G2: Model control group, G3: positive control group, G4: low dose genistein treated group, G5: High dose genistein treated group.
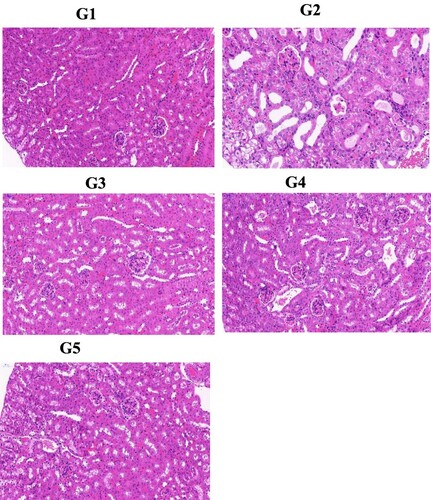
Figure 6. Genistein attenuates renal fibrosis inhibits the Wnt/β-catenin and its downstream target genes expression in PO-induced hyperuricemic mice., G1: normal group, G2: Model control group, G3: positive control group, G4: low dose genistein treated group, G5: High dose genistein treated group, *p < .05, **p < .01, ***p < .001 compare with G1, #p < .05, ##p < .01, ###p < .001 compare with G2.
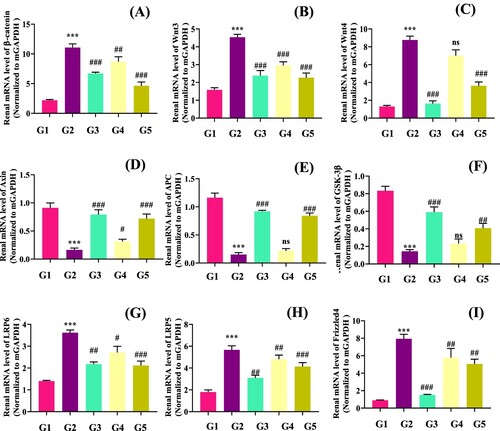
Figure 7. Genistein attenuates renal fibrosis via inhibiting JAK2/STAT3 pathway and its downstream target genes expression in PO-induced hyperuricemic mice, G1: normal group, G2: Model control group, G3: positive control group, G4: low dose genistein treated group, G5: High dose genistein treated group *p < .05, **p < .01, ***p < .001 compare with G1, #p < .05, ##p < .01, ###p < .001 compare with G2.
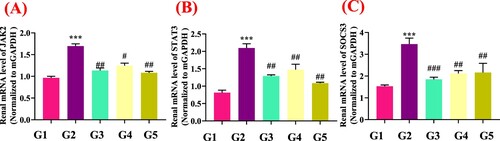
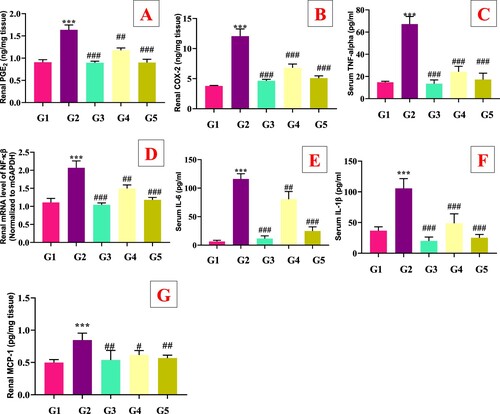
Figure 8. Effect of genistein on serum inflammatory cytokines levels in PO-induced hyperuricemic mice. (A) Renal PGE2, (B) Renal COX-2, (C) Serum TNF-α, (D) Renal genes expression of NF-κβ, (E) Serum IL-6, (F) Serum IL-1β, (G) Renal MCP-1, G1: normal group, G2: Model control group, G3: positive control group, G4: low dose genistein treated group, G5: High dose genistein treated group, *p < .05, **p < .01, ***p < .001 compare with G1, #p < .05, ##p < .01, ###p < .001 compare with G2.
Data availability statement
All data are presented in the figure. However, additional information can be obtained from corresponding author on request.