
Figures & data
Figure 1. (a) The synthesis procedure of CLO-BSA; (b) Identification of CLO-BSA by SDS-PAGE; (c) The titer curve of the four mice pAb; (d) Sensitivity identification of the No.2 mouse pAb.
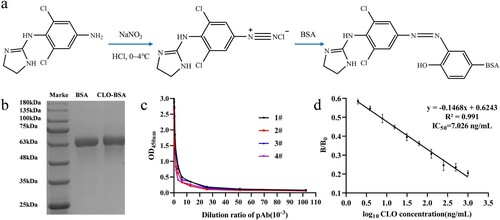
Figure 2. (a) The identification of the mAb (34F10) subclass; (b) The sensitivity of 34F10 identified by ic-ELISA.
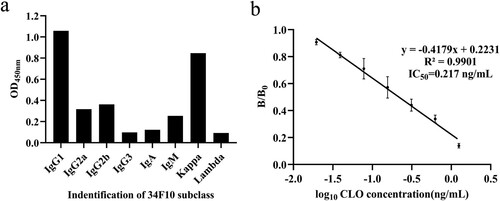
Figure 3. (a) The checkerboard titration experiment; (b) The standard curve of ic-ELISA.
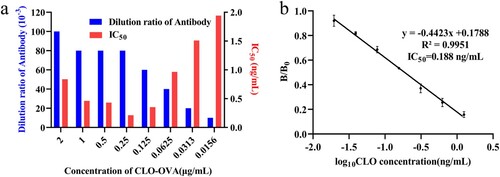
Table 1. The cross-reaction of mAb with other agonist drugs.
Figure 4. Elimination of matrix effects in (a) pig urine sample and (b) pork sample; (c) IC50values for pig urine sample and pork sample following different dilutions with PBS; ND: not detected.
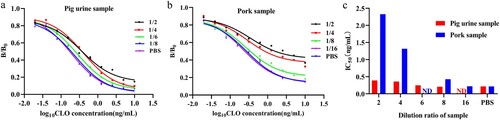
Figure 5. Correlation between the analysis of CLO in pig urine via the ic-ELISA and HPLC methods.
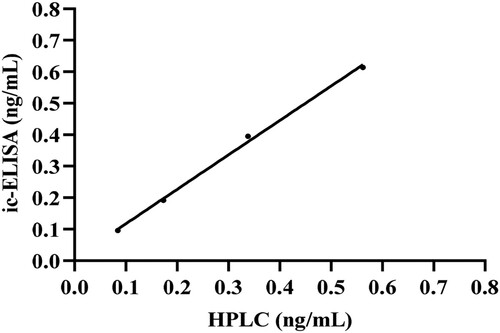
Table 2. The recovery experiment of the ic-ELISA for CLO in pig urine and pork samples.