
Figures & data
Figure 1. A graphical representation of the qualitative data structure.
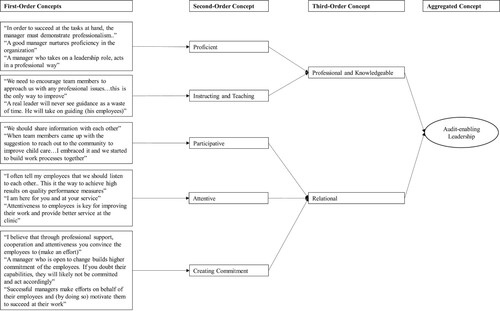
Table 1(a). Descriptive statistics of the variables (level 1).
Table 1(b). Descriptive statistics of the variables (based on randomly sampled respondents) (level 2).
Table 2(a). Correlations between the research variables (level 1).
Table 2(b). Correlations between the research variables (level 2).
Table 3. Fit-of-indices for the measurement models.
Table 4. SEM results for the baseline model.
Figure 2. Illustrative results of the model.
Notes: Dashed lines denote direct relationships; Dashed lines denote link that were not originally hypothesized; Trust-quality internal audit link is not shown (because only significant relationships are shown here), but was originally hypothesized.
**p < .01; ***p < .001; Control variables are not shown here.
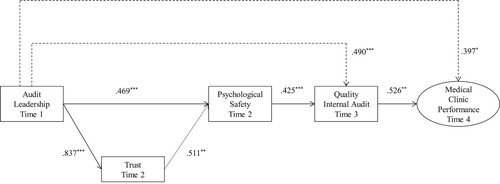
Table 5(a). SEM results for baseline and alternative models.
Table 5(b). Indirect and total effects for audit-enabling leadership on internal audit quality (AL → IAQ).
Table 5(c). Indirect and total effects for audit-enabling leadership on medical clinic performance (AL → UP).
Table 6. Measurement items and sources and MSA-Kaiser values.