Figures & data
Figure 1. Perspectives on product and perceived quality.
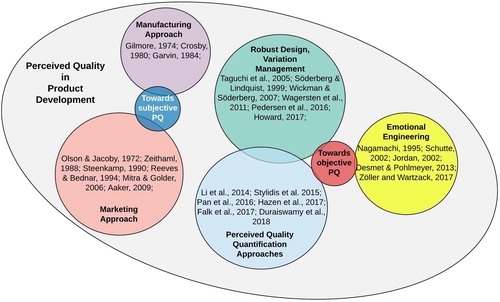
Table 1. An overview of the interviewees for semi-structured interviews.
Figure 2. Procedure for the attributes complete list collection and PQF composition based on industry input.
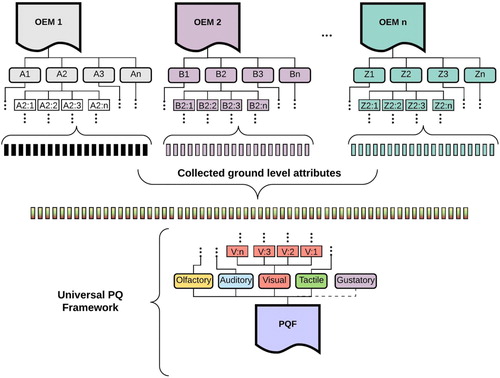
Figure 3. Attributes levels of the PQF.
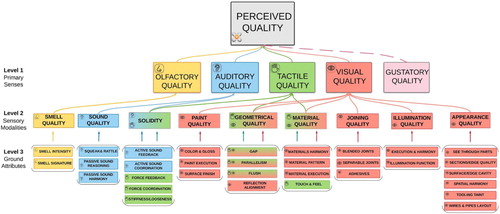
Figure 4. Each identified Ground Attribute is mapped into the PQF, and importance ratings can be calculated per attribute at every level.
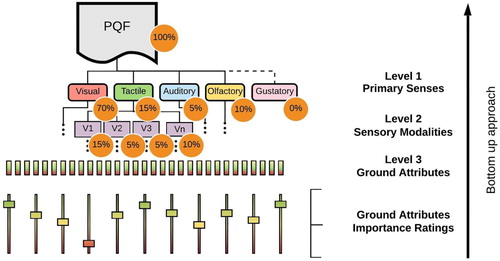
Figure 5. PQAIR method analysis procedure.
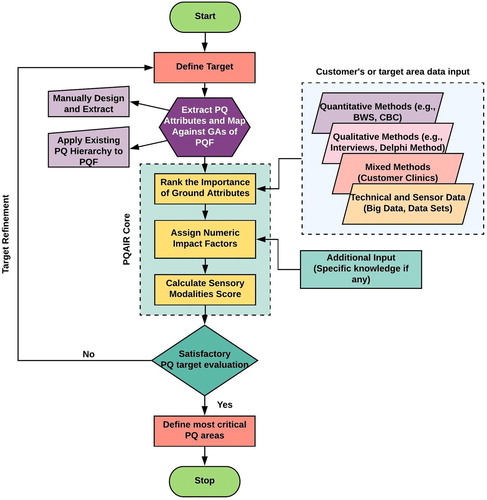
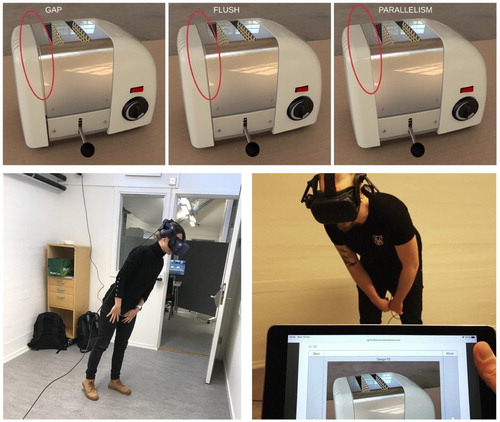
Figure 6. Descriptive and visual guidance regarding one Ground Attributes (‘Gap’).
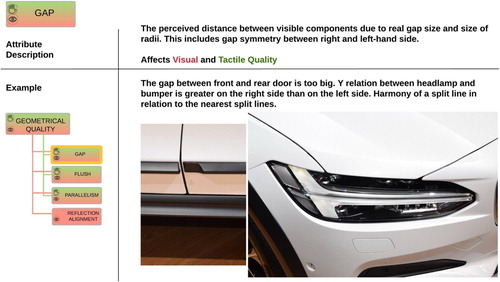
Table 2. The Ground Attributes importance ratings obtained from the team ‘Designers’ during the pilot study.
Table 3. The Ground Attributes importance ratings obtained from the team ‘Customers’ during the pilot study.
Figure 7. Perceived quality attributes importance ranking values for relevant PQF areas regarding a ‘generic’ SUV intended for the EU premium market segment for both teams.
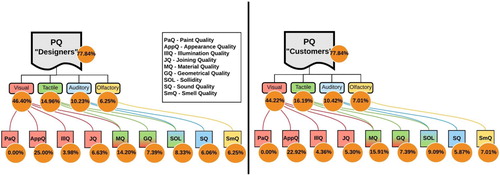
Figure 8. Perceived quality assessment process loop for successful engineering design intent implementation with customer feedback.
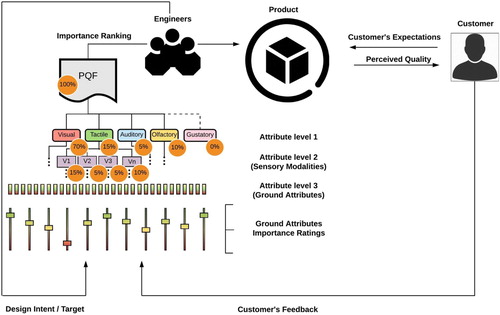
Figure 9. Fully immersive head-mounted display system exercise for evaluation of a bread toaster split-lines.