
Figures & data
Figure 1. The whole process and time span of the experiment.
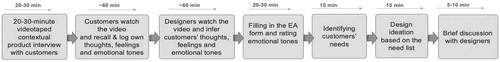
Figure 2. Customer interview in the Vehicle Laboratory.
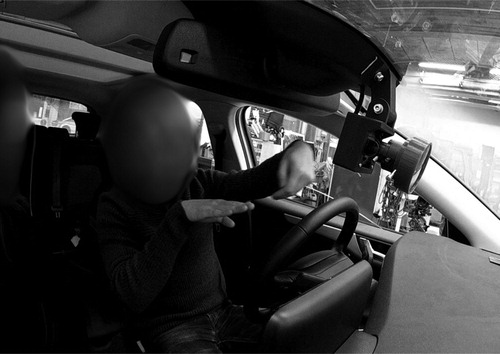
Table 1. Example of customer’s entry form.
Table 2. An example of similarity rating
Table 3. Examples of design-related ratings of users’ entries.
Table 4. Summary of Hierarchical Regression Analysis for Variables predicting Empathic Accuracy.
Figure 3. A boxplot of designers’ empathic accuracy of understanding Finnish and Chinese users.
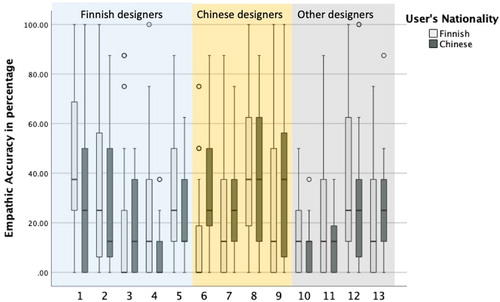
Figure 4. A bar chart of designers’ emotional tone accuracy of understanding different users.
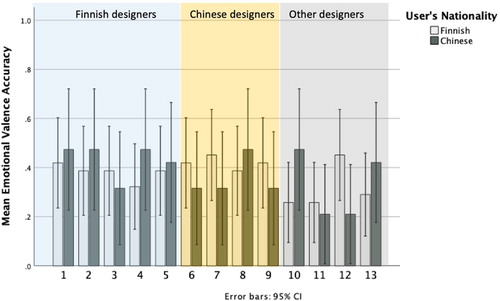
Table 5. Summary of Hierarchical Regression Analysis for Variables predicting Emotional Tone Accuracy.
Figure 5. A hierarchical linear model of predicting variances of empathic accuracy and emotional tone under independent variables of national cultural differences and visiting experience.
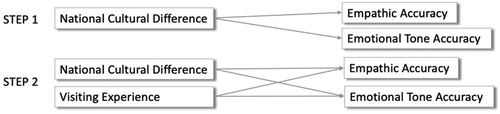
Figure 6. Comparison of designers’ empathic accuracy in two cultural groups.
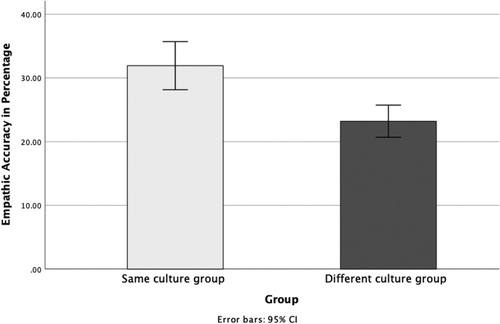
Figure 7. Comparison of designers’ empathic accuracy under different visiting experiences.
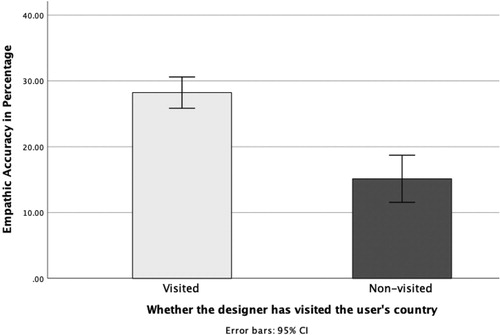
Figure 8. Comparison of designers’ empathic accuracy under the independent variable of whether the customer’s entry is design-related.
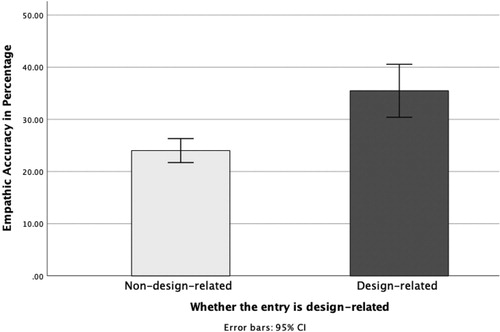
Table 6. Comparison of designers’ empathic accuracy of inferring design-related and non-design-related entries.
Figure 9. A boxplot of designers’ design-related and non-design-related empathic accuracy.
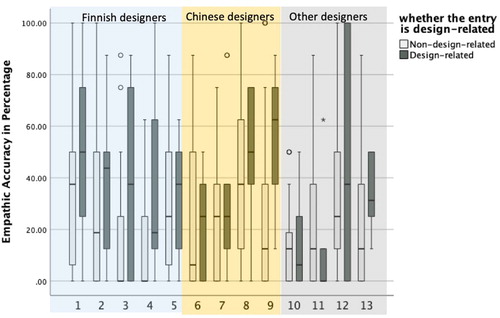
Figure 10. A hierarchical linear model of predicting variances of design-related and non-design-related empathic accuracy under independent variables of national cultural differences and visiting experience.
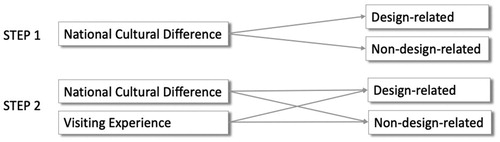
Table 7. Summary of Hierarchical Regression Analysis for Variables predicting Design-related Empathic Accuracy.
Table 8. Summary of Hierarchical Regression Analysis for Variables predicting Non-design-related Empathic Accuracy.
Figure 11. Comparison of designers’ design-related and non-design-related empathic accuracy under the influence of national cultural differences.
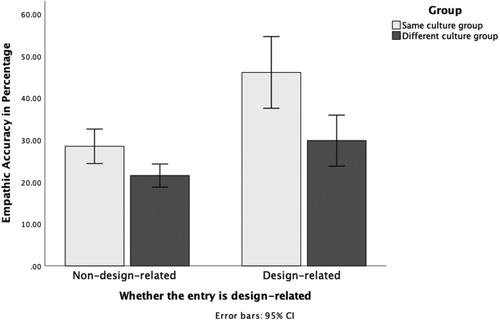
Figure 12. Comparison of designers’ design-related and non-design-related empathic accuracy under the influence of visiting experience.
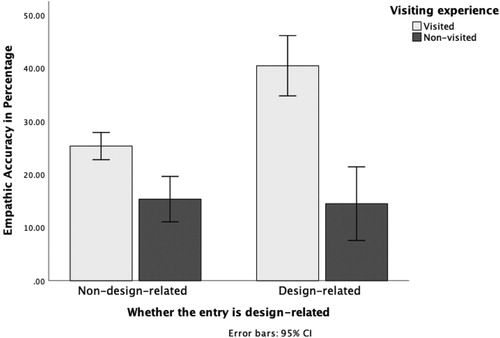
Table 9. Examples of opinions from designers and customers under the same topic