
Figures & data
Figure 1. Need for a biodosimetry test based on overlapping clinical symptoms and association with survival after a 10 kT nuclear incident (based on numerical data from Buddemeier et al. Citation2011). Severities of symptoms (vomiting, headache, fever, diarrhea, altered metal state/unconsciousness) are representative of published information (Waselenko et al. Citation2004; Demidenko et al. Citation2009; Coleman et al. Citation2011). Hematology information is based on the ability to obtain multiple collections post exposure to determine depletion kinetics (Figure 3 from Coleman et al. Citation2011).
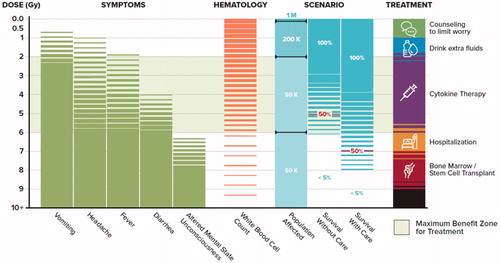
Figure 2. REDI-Dx workflow overview.
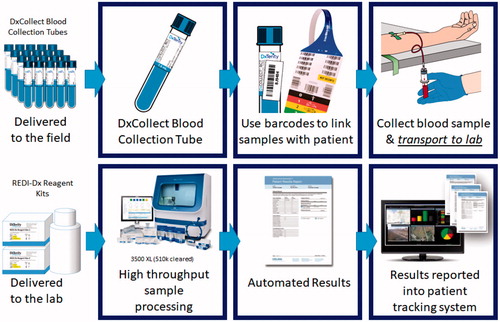
Table 1. Subset of REDI-Dx test genes.
Table 2. Testing across a wide range of human demographics.
Table 3. Age distribution of human demographic samples.
Table 4. Testing with samples from subjects with potentially confounding conditions.
Figure 3. ROC curves for actual absorbed dose >2.0 Gy using REDI-Dx. Red bars show 95% CI for specificity at the REDI-Dx sensitivity using a cut-off of 2.0 Gy.
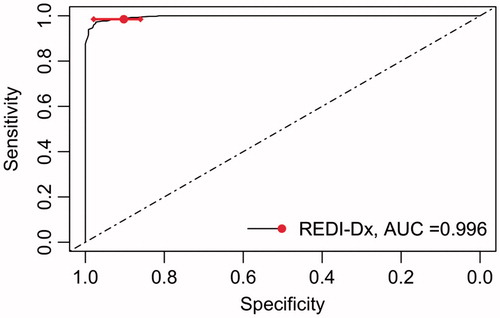
Figure 4. ROC curves for actual absorbed dose >6.0 Gy using REDI-Dx. Red bars show 95% CI for sensitivity at the REDI-Dx specificity using a cut-off of 6.0 Gy.
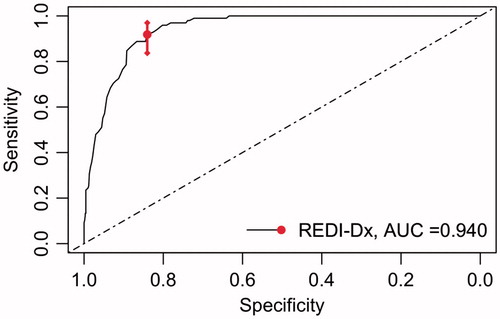
Figure 5. REDI-Dx ROC curves for actual absorbed dose >2.0 Gy, by time post irradiation (TPI) in hours.
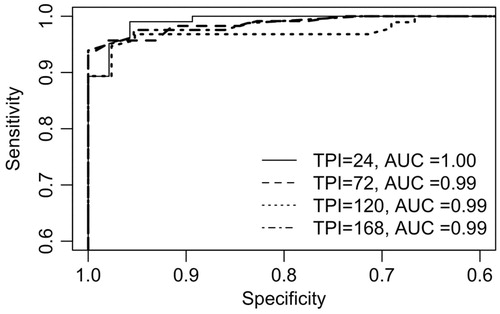
Table 5. Sensitivity, specificity and 95% CI for specificity at REDI-Dx cut-off.
Figure 6. ROC curves produced by REDI-Dx and Model-Dx for actual absorbed dose >2.0 Gy using observed REDI-Dx distribution and bootstrapped Model-Dx samples.
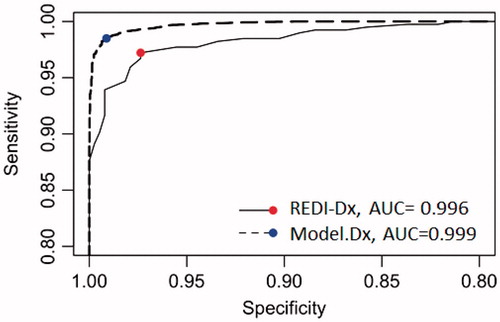
Table 6. Comparison of REDI-Dx and Model-Dx sensitivity and specificity.
Table 7. Multi-center reproducibility and repeatability by variance components analysis.
Table 8. Hands on time and total assay time (h:min) based on an average of three sites and six technicians.