Figures & data
Figure 1. Representative images of γ-H2AX immuno-stained SCL-II cells after exposure to γ-radiation or I-125-UdR taken by a confocal laser scanning microscope. Exposure was carried out in frozen cells. Cells were PFA-fixed 30 min after thawing and subsequently immuno-stained (Anti-phospho-histone H2AX (139) clone JBW301; Alexa Fluor 488 goat anti-mouse IgG (H + L); DAPI).
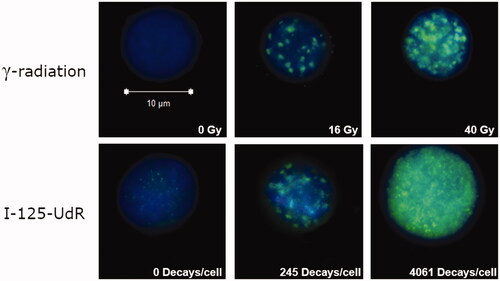
Figure 2. Quantification of the mean γ-H2AX signal intensity by flow cytometry (>10,000 cells/events per data point) as a function of accumulated decays per cell after I-125-UdR exposure (A) or as a function of radiation dose after γ-irradiation (B). Values are normalized to respective controls. In the dose range from 8–40 Gy the relative γ-H2AX signal intensity increased significantly after γ-irradiation when compared to non-irradiated controls (p < .05).
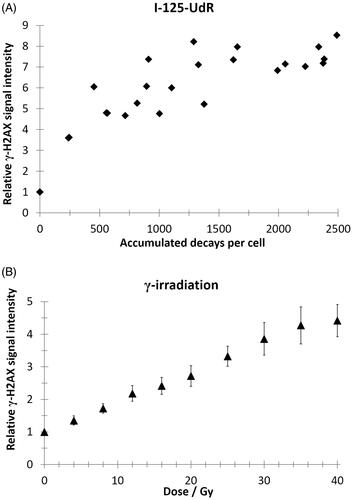
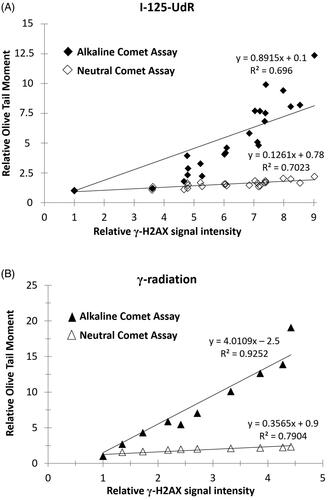
Figure 3. The relative Olive Tail Moment data of the alkaline Comet Assay (A) or neutral Comet Assay (B) are shown as a function of the relative γ-H2AX signal intensity after exposure to I-125-UdR and γ-radiation.
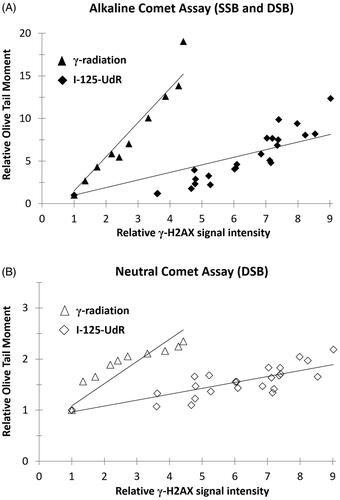
Figure 4. The relative Olive Tail Moment data of the alkaline and neutral Comet Assay are shown as a function of the relative γ-H2AX signal intensity after exposure to I-125-UdR (A) or γ-radiation (B). The SSB/DSB ratios were calculated from the slopes of the regression curves showing a SSB/DSB ratio of 6:1 for DNA-incorporated Auger electron emitter Iodine-125 and a SSB/DSB ratio of 10:1 for external γ-irradiation, respectively.