Figures & data
Figure 1. Study overview. Study design overview including X-irradiation of EDTA-whole blood samples, in vitro culture, whole blood cell population separation (including one whole blood cell culture), RNA isolation and gene expression measurements, and flow cytometry measurements showing successful cell separation.
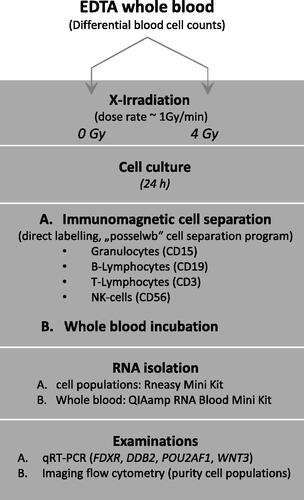
Table 1. Overview on radiation-induced gene expression changes in whole blood and four cell populations under different considerations.
Figure 2. Quantities in leucocyte counts and relative composition of four cell populations with and without irradiation. The left part of the figure presents leucocyte counts (left Y-scale) in unirradiated (0 Gy) and irradiated (4 Gy) whole blood cultures (‘cult’) which were either incubated for a few minutes (referred to as ‘0h cult’) or 24 h (referred to as ‘24h cult’). The right part of the figure depicts the relative composition (in percent, right Y-scale) of the four leucocyte cell populations on the x-axis. Bars represent the mean and error bars the standard error of mean (n = 4). Differences between groups (absolute leucocyte counts and relative compositions of cell populations) are not statistically significant.
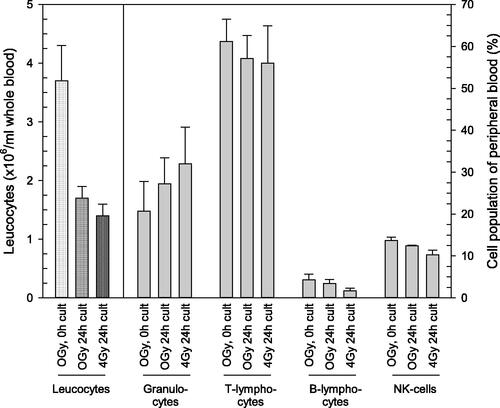
Figure 3. Purity of four cell populations after immunomagnetic cell separation. After immunomagnetic cell separation of T-lymphocytes, B-lymphocytes, NK-cells and granulocytes, these cells were examined using flow cytometry for the efficiency of the cell separation process. Typical density plots (0 h, 0 Gy, single donor) are presented for the cell populations as outlined in the images. The density plot represents a three dimensional scatter plot and shows quantities of cell counts using a color code (red = highest, blue = lowest quantities). The table below reflects the corresponding purity of each separated cell type (in percent) and treatment conditions.
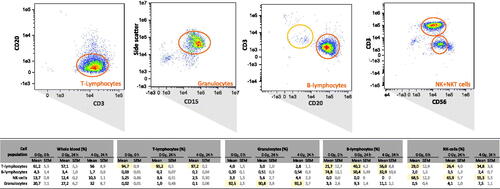
Figure 4. Examining RNA yields in whole blood and cell populations with and without irradiation. Isolated RNA yields (µg/ml whole blood) in whole blood (showing expected values based on previous experiments and served as positive control) and four cell populations of peripheral blood is indicated on the x-axis. Measurements were performed in irradiated (4 Gy, gray filled bars) and unirradiated (0 Gy, white filled bars) whole blood cell cultures. The inserted pie chart represents the relative contribution of the four cell population on RNA yield measurements in percent. Bars refer to the mean and error bars to the standard error of the mean (n = 6). A p-value of .04 is marked with one asterisk and refers to RNA yield differences between unexposed and exposed B-cells.
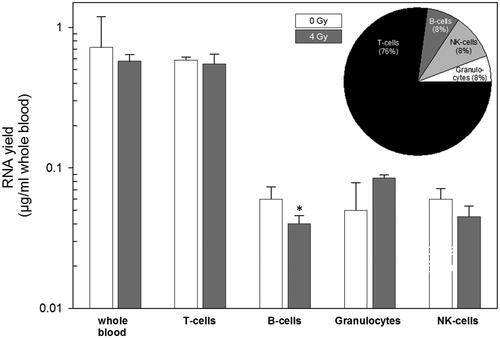
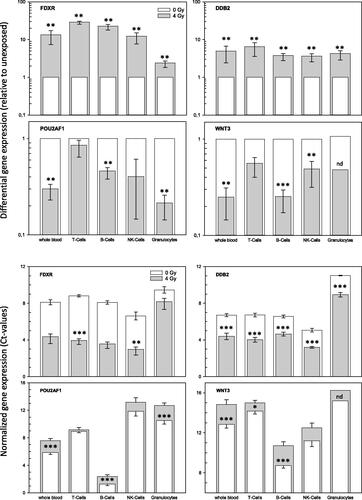
Figure 5. Gene expression measurements of four genes in whole blood and four cell populations. The figure describes fold-differences relative to unexposed in the upper panel and normalized gene expression changes in the lower panel. Upper panel: Differential gene expression of FDXR, DDB2, POU2AF1 and WNT3 was measured in peripheral whole blood and four cell populations of peripheral blood in six healthy donors after irradiation (cell culture). Fold changes were calculated relative to the corresponding unexposed samples used as a reference and set to the value 1. Symbols reflect the geometric mean and error bars show the standard error of mean (n = 6). Missing error bars in irradiated samples (e.g. granulocytes) reflect measurements performed in one individual only (see Supplemental figures). Lower panel: Normalized gene expression (expressed as Ct-values) of FDXR, DDB2, POU2AF1 and WNT3 was measured in peripheral blood and four cell populations of peripheral blood in six healthy donors at 0 Gy (baseline) and 4 Gy. Symbols reflect the geometrical mean and error bars show the standard error of mean (n = 6). Ct-values represent inverse log-2 transformed gene expression changes. For instance, higher Ct-values refer to less RNA copy numbers and the other way around and one Ct-value difference corresponds to two-fold differences in RNA copy numbers. p-Values were calculated between exposed and unexposed samples for each cell population and p-values ≤.05–.01, <.01–.001 and <.0001 are marked with one, two and three asterisks. Abbreviations. nd: not determined, due to missing multiple measurements.