Figures & data
Figure 1. (A) Representative dose-response curve used in determining a NOAEL or BMD value following exposure to a stressor. The blue line indicates the fitted curve, while the grey dashed lines indicates the 95% confidence interval of the fit (BMDL/U). For more information. see Benchmark Dose Technical Guidance Document (US EPA, Citation2012). (B) Definitions of abbreviations commonly used in reference to BMD modeling.
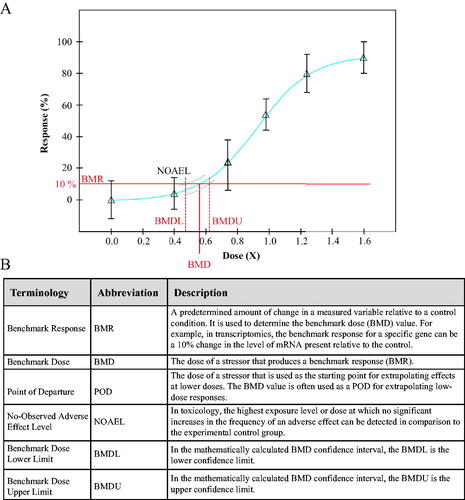
Figure 2. (A) The proportion of mathematical models used in the modeling of genes from irradiated cells of each group of participants. Female (F) and male (M) are the sexes of the participants, and nonsmoking (NS) and smoking (S) denote their smoking status. (B) Histogram of the distribution of genes in the four study groups based on best BMD values. The black line (–) separates genes between the two modes at 0.5 Gy. The red line (–) indicates the overall median BMD of each group, while dashed-blue line (--) indicates the median for the respective mode.
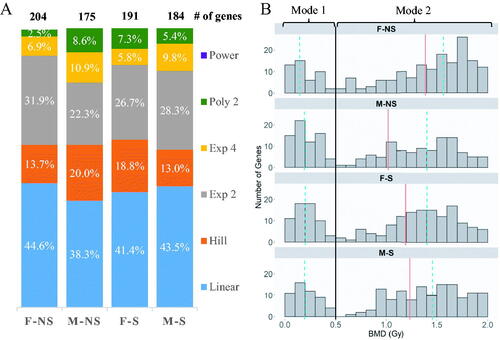
Figure 3. (A) Upset plot of the genes from the irradiated white blood cells that were successfully modeled by BMD analysis. The set size refer to the total number of genes per group. (B) Hierarchical cluster analysis of the 62 genes modeled by BMD methodology across the four study groups. The color scale corresponds to the BMD values (in Gy) of the genes.
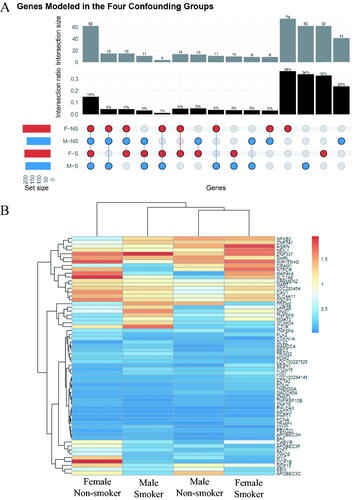
Figure 4. BMD values of selected genes successfully modeled across the four study groups. The selected genes in this figure are the clusters of genes where differences among the groups that may be observed in . The error bars indicate the lower BMD (BMDL) and upper BMD (BMDU) values in Gy, indicating the 95% confidence interval of the gene.
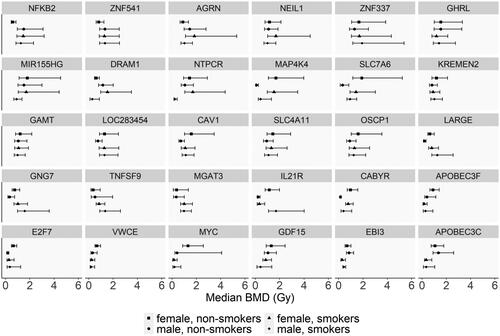
Figure 5. Accumulation plot showing the number of (A) genes and (B) pathways modeled from the lowest to the highest BMD for each of the study groups.
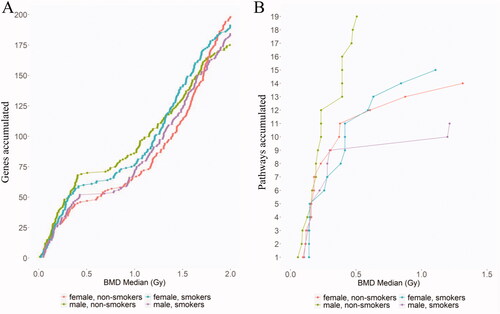
Figure 6. (A) Upset plot of the responsive pathways with BMDs. F and M are the sex of the participants, and their smoking status are either nonsmoker (NS) or smoker (S). The set size refer to the total number of pathways per group. (B) Hierarchical cluster analysis of the common pathways fitting BMD models across four confounding groups. The color scale corresponds to the BMD values (in Gy) of the pathways. F and M are the sex of the participants, and their smoking status are either nonsmoker (NS) and smoker (S).
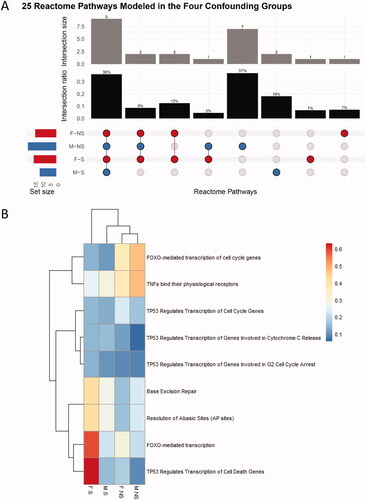
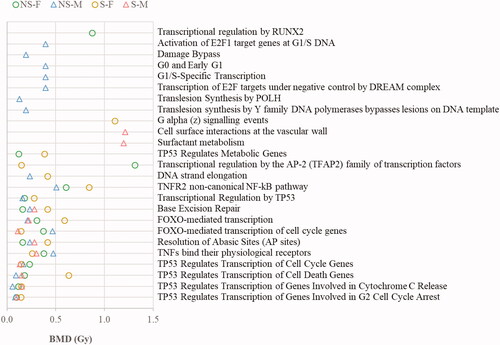
Figure 7. Median BMD values of the pathways successfully modeled across the four study groups. M are the sex of the participants, and their smoking status are either nonsmoker (NS) or smoker (S). The number of pathways modeled for each confounding group is 14 (F-NS), 19 (M-NS),15 (F-S) and 11 (M-S).